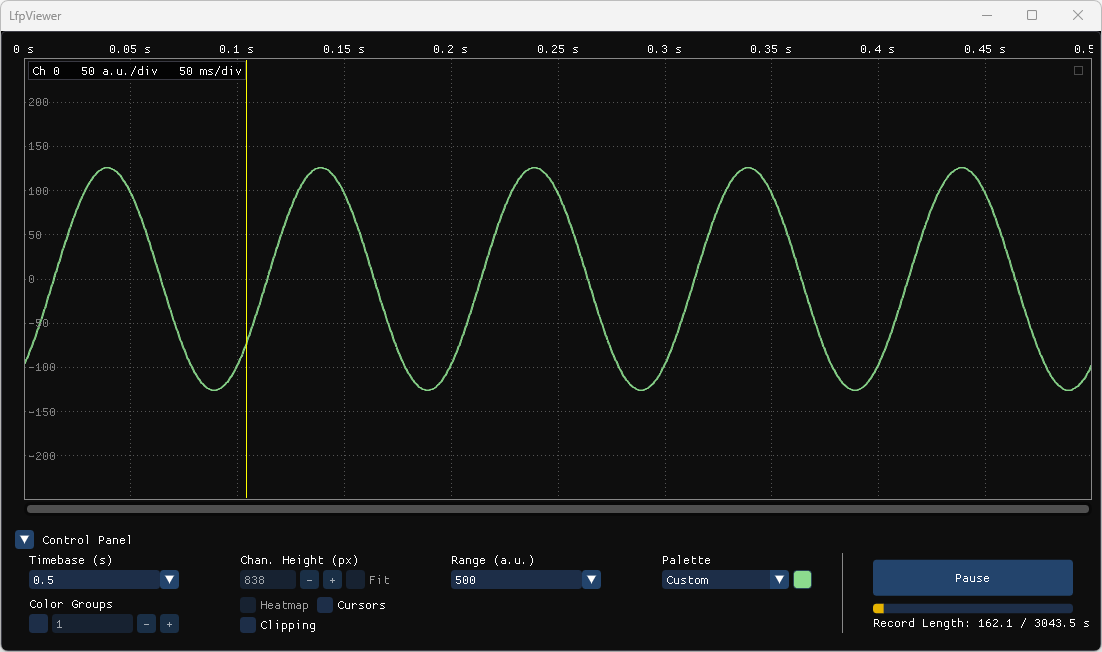
Waveform Scope
The WaveformScope node shows a sequence of matrices as a live multichannel waveform display. Each matrix is one block of samples, with one row per channel and one column per sample, of any element type and one value per element. Data in .NET arrays can be converted to matrices first (see Array input). The node passes its input through unchanged, so it can sit anywhere in a workflow, and its display opens like any other visualizer.
Getting started
This workflow plays back a NeuropixelsV2 recording, saved by the Open Ephys GUI as 384 channels of signed 16-bit samples at 30 kHz, with MatrixReader, and loops it with Repeat. To use it, set the reader's Path to a recording of your own, and its ChannelCount, SampleRate and Depth to match it.
The WaveformScope's settings describe the samples it is given:
- SampleRate is left at its default of 30000, the recording's rate.
- Scale is 0.195, the microvolts each count stands for in this recording, so the amplitudes shown are in microvolts, though they are shown without a unit, since the viewer cannot know that.
- Offset is left at 0, since the samples are signed and centered on zero.
- SaturationLow and SaturationHigh are left empty, so a channel is marked as clipping when a sample reaches −32768 or 32767, the limits of 16-bit samples.
For a signal that needs no hardware or recording, see Single channel.
The viewer opens like any visualizer, from the node, and can be closed and reopened during a run. To open it when the workflow starts, including when Bonsai runs without the editor (--no-editor), place Bonsai's VisualizerWindow operator after the node; its properties set the window's position and size.
Every control has a tooltip saying what it does and naming its keys and gestures. Labels name only the control and, in parentheses, its unit.
Array input
The viewer takes OpenCV matrices. Data held in .NET arrays, such as arrays from a device or a script that never uses OpenCV, can be converted into matrices by Bonsai.Dsp's ConvertFromArray placed before the viewer. Its Size gives the matrix's width, which is its number of columns, and its height, which is its number of rows. When each channel's samples are stored together, the width is the number of samples in each array and the height is the number of channels:
Here the arrays come from FunctionGenerator and ConvertToArray, so the workflow runs as it is. Each array holds 300 samples of one sine wave, which ConvertFromArray cuts into 10 rows of 30 samples, so the viewer shows 10 channels sampled at 3 kHz.
When each sample's channels are stored together, so that the channels are interleaved, Size is the other way round, with the channels as the width. Transpose then turns the matrix so that its rows are the channels:
Here the arrays come from the same kind of generator, making a 100 Hz sine wave. Its consecutive values go to the 10 channels in turn, so each channel holds every tenth value, and the viewer shows 10 channels sampled at 3 kHz.
Warning
ConvertFromArray does not check an array's length against Size. It cuts a longer array short, and it reads past the end of a shorter one, so the matrix holds memory that is not part of the array, and Bonsai can crash (bonsai-rx/bonsai#2678). Every array must hold exactly width × height values.
The matrix's depth follows the array's element type, unless ConvertFromArray's Depth is set. SaturationLow and SaturationHigh, when left empty, fall back to the limits of an integer element type, and floating-point arrays are not checked, as with matrix input.
Settings
The display's settings are properties of the node, saved with the workflow. The viewer reads and writes them directly, so a change made in the viewer is saved with the workflow, including when it is saved during a run, and a change made in the property grid shows in the viewer at once.
Input
| Property | Description |
|---|---|
| SampleRate | Each channel is sampled at this rate, in Hz, which sets the time axis. |
| Scale, Offset | What is drawn is (sample − Offset) × Scale, as when turning ADC counts into microvolts. The viewer cannot know what unit that gives, so amplitudes are shown without a unit. The expanded channel's amplitude per division is the one exception, which reads a.u./div, for arbitrary units. |
| SaturationLow, SaturationHigh | A channel is marked as clipping when a sample, before Offset and Scale are applied, reaches either of these values (see Clipping). When they are left empty, the limits of the input's integer type are used, such as 0 and 65535 for unsigned 16-bit samples, and floating point input is not checked. An ADC that does not fill its type, such as a 10-bit ADC in 16-bit samples, never reaches those limits, so for it they need to be set. |
| HistorySize | This is the memory, in megabytes, given to the record of recent signal that a paused view is redrawn from. How many seconds that holds depends on the channel count and sample rate, and is shown in the control panel. |
Display
Each of these is also a control in the viewer (see Control panel).
| Property | Control |
|---|---|
| Timebase | Timebase |
| RangeAmplitude | Range |
| RangeHeatmap | The range box in Color |
| ChannelHeight, FitChannels | Chan. Height and Fit |
| Palette, CustomColor | Palette |
| ColorGroupingEnabled, ColorGrouping | Color Groups |
| ShowHeatmap, ColorThreshold | Heatmap and Color |
| ShowClipping | Clipping |
| Channels | The channel labels, for the channels hidden |
| Maximized | The maximize button |
Keys and mouse
The viewer is meant to be driven while watching the data, without reaching for the control panel. The left hand rests on W, A, S and D, with Shift, Ctrl and Alt beside them, and the right hand on the mouse, as in a game. Between them they move through channels and time, zoom, and set the gain in quick strokes, so that a burst on one channel can be found, magnified and measured in a few seconds.
The keys and the mouse follow one scheme:
- W and S, and the wheel, move through the channels. A and D, and the wheel with Shift, move through time, which a paused view can do, since a live one follows the incoming data.
- Shift makes a move larger, most of a screen rather than a channel or a division. On the mouse it turns the wheel sideways, as in other applications.
- Ctrl zooms: with W and S, or the wheel, it sets the channel height; with A and D, or the wheel with Shift as well, it sets the timebase.
- Alt sets the gain, the range, with W and S, the wheel, or a drag.
- Up and right magnify.
Every key and gesture acts on a setting that a control in the control panel shows, so its effect is always in view and can also be set by hand there.
runs through them on a recording.
Keys
Each key has a single owner in the window, so a key does the same thing wherever the pointer is within it. Keys are ignored while typing in a text field. Keys reach the viewer under the pointer, whichever window has the keyboard.
| Key | Action | When |
|---|---|---|
| Space | Pause or resume | Always |
| W / S | Scroll the channels up or down by one channel | Always |
| Shift+W / Shift+S | Scroll the channels by most of a screen | Always |
| Ctrl+W / Ctrl+S | Make the channels taller or shorter, to the next multiple of 5 px | No channel expanded |
| Alt+W / Alt+S | Narrow or widen the range, through its presets | Always |
| A / D | Move back or forward in time by one division | Paused |
| Shift+A / Shift+D | Move back or forward in time by most of a screen | Paused |
| Ctrl+A / Ctrl+D | Lengthen or shorten the timebase, through its presets, about the middle of the plot | Always |
| C | Show or hide the cursors | Always |
| Left / Right | Step the active cursor back or forward by one pixel column | Cursors shown |
| Shift+Left / Shift+Right | Step the active cursor by ten pixel columns | Cursors shown |
| + | Add a cursor in the middle of the plot and make it the active cursor, as + Add cursor does | Cursors shown, fewer than four |
| − or Delete | Remove the active cursor, as its x button does | Cursors shown, the active cursor not the reference |
| H | Switch between traces and the heatmap | More than one channel |
| F | Turn Fit on or off (see Chan. Height) | More than one channel |
| T | Set the longest timebase. While paused, that is the longest the record can fill, so the whole record is in view | Always |
| M | Give the plot the whole window, or restore the layout | Always |
| Q / E | Select the previous or next channel, skipping hidden channels. With a channel expanded, expand that one instead | Always |
| Escape | Clear the selection, or cancel a zoom box being dragged, leaving the selection | Always |
| X | Expand the selected channel, selecting the first shown channel in view if none is, or collapse the expanded one, returning to the view from before the expand, moved only as far as brings the channel into view | More than one channel |
| L | Widen the lane under the pointer, or the selected channel's lane, shrinking the others, or give the lanes equal widths again if it is the one widened, as the lane's button does | The rows shown in lanes, which a viewer built on this one may do |
Mouse
Dragged zooms and gain round to three significant figures, and an axis answers only past a few pixels, so a drag along one barely moves the other.
| Gesture | Where | Action | When |
|---|---|---|---|
| Wheel | Plot or channel labels | Scroll the channels, or on an expanded channel move up or down its amplitudes by a division per notch | Always |
| Shift+Wheel, or a sideways swipe or tilt | Plot or channel labels | Move back or forward in time by a division per notch | Paused |
| Ctrl+Wheel, or a pinch | Plot | Make the channels taller or shorter, to the next multiple of 5 px, keeping the channel under the pointer in place. On an expanded channel, magnify or shrink its amplitude, keeping the value under the pointer in place | Always |
| Ctrl+Shift+Wheel | Plot | Shorten or lengthen the timebase through its presets, keeping the time under the pointer in place while paused | Always |
| Alt+Wheel | Plot | Narrow or widen the range through its presets | Always |
| Ctrl+Drag | Plot | Drag up or down to make the channels taller or shorter, keeping the channel pressed on in place, or on an expanded channel to magnify or shrink its amplitude, keeping the value pressed on in place. Drag right or left to shorten or lengthen the timebase, keeping the time pressed on in place. A diagonal drag does both | Paused |
| Alt+Drag (vertical) | Plot | Narrow the range upward, widen it downward | Always |
| Right-drag | Plot | Zoom to the box dragged: the timebase to its width, starting at its left edge, and the channels it touches to fill the plot, or on an expanded channel the amplitude to its height. A box no wider than a few pixels leaves the timebase as it is, and one no taller leaves the channels or amplitude, so a flat or narrow box zooms one axis alone. While live, only its height counts, since the sweep moves under its edges: it zooms the channels or amplitude and leaves the timebase. While it is dragged, the box is drawn as it will zoom, across the whole plot along an axis it leaves. Escape cancels it | Always |
| Right double-click | Plot | Zoom all the way out: the longest timebase, every channel fitted to the plot once, leaving Fit as it is, and on an expanded channel its whole range | Always |
| Middle-drag | Plot or channel labels | Grab the plot and move it with the pointer: through the channels, or an expanded channel's amplitudes, and through time while paused | Always |
| Double-click | A channel | Expand the channel to fill the plot, or collapse it, returning to the view from before the expand, moved only as far as brings the channel into view | More than one channel |
| Click / Drag (vertical) | Channel labels | Show the channel, or every channel dragged across, whether hidden or not. A click also selects the channel | No channel expanded |
| Shift+Click / Shift+Drag (vertical) | Channel labels | Hide the channel, or every channel dragged across | No channel expanded |
| Drag | Time scroll bar below the plot | Move through time | Paused |
| Drag (horizontal) | A cursor line | Move the cursor, snapping to the pixel under the pointer | Cursors shown |
| Click | A channel's trace, away from the cursor lines | Select the channel, which the cursors read | No channel expanded |
| Hover | A channel | Show its readout, and, when no channel is expanded, highlight its label and outline its trace, or in the heatmap draw grey lines just above and below its row | Always |
Control panel
The control panel is the row of controls under the plot (). Each control shows and sets one of the node's display settings.

| Control | Description |
|---|---|
| 1. Collapse arrow | The arrow folds the control panel away, or brings it back. |
| 2. Timebase | Timebase sets the seconds the plot spans. Type a value, or pick a preset from the arrow. While the display is paused, only the presets the record can fill are offered. |
| 3. Chan. Height | Chan. Height sets the height of each channel's row, in pixels. It is never less than the fit height, at which every channel just fills the plot's height (or 1 px, if there are more channels than pixels), and anything that would set it lower sets the fit height instead. The − and + buttons, like Ctrl+Wheel, go to the next lower or higher multiple of 5 px. Fit keeps the height at the fit height, following the window as it is resized, and disables the box; F turns it on or off. Ctrl+Wheel and Ctrl+Drag still change the height, which turns Fit off. |
| 4. Range | Range sets the amplitude one channel's row spans, in the units the node's Scale and Offset give. Type a value, or pick a preset from the arrow. The presets step 1, 2.5, 5, 10 through the decades around the current range, so they suit data of any size. |
| 4. Color | While the heatmap is drawn, Color replaces Range. An expanded channel is drawn as a trace, so it shows Range even with the heatmap on. Color's bar shows both halves of the colormap, positive above and negative below, and runs from 0 up to the range box at its right end, which works as Range does in trace view. The heatmap keeps a range of its own, so switching between the views restores each one's range. Drag anywhere on the bar to set the threshold, whose value follows the handle: magnitudes at or below it are drawn black, and those above it keep their usual color. |
| 5. Palette | Palette sets the colors of the traces while they are not in color groups: Open Ephys GUI; Glasbey, colors chosen to be told apart, the ones color groups take; or Custom, one color for every trace, picked from the swatch it adds. |
| 6. Color Groups | When Color Groups is checked, consecutive channels share a color in groups of the given size (). The − and + buttons step the size. The groups take their colors from a palette of their own, chosen to tell groups apart, whatever Palette is set to. A size at least the channel count draws every channel in one color. |
| 7. Heatmap, Cursors, Clipping | These are three checkboxes in one column. Heatmap, key H, draws each channel as a row of color instead of a trace (see Heatmap). Cursors, key C, shows or hides the cursors and the cursor table. Clipping, on by default, shows or hides the clipping warning: CLIPPING and the flashing labels (see Clipping). |
| 8. Pause | The Pause button pauses or resumes the display, as Space does, and is highlighted while the display is paused. |
| 9. Record bar and Record Length | The record of recent signal, which a paused view is redrawn from, is a ring buffer whose size is set by the node's HistorySize. The bar shows how full it is, and Record Length gives the seconds it holds out of the seconds it can hold. Once it is full, each new sample replaces the oldest, so it always holds the most recent signal, and the bar stays full. |
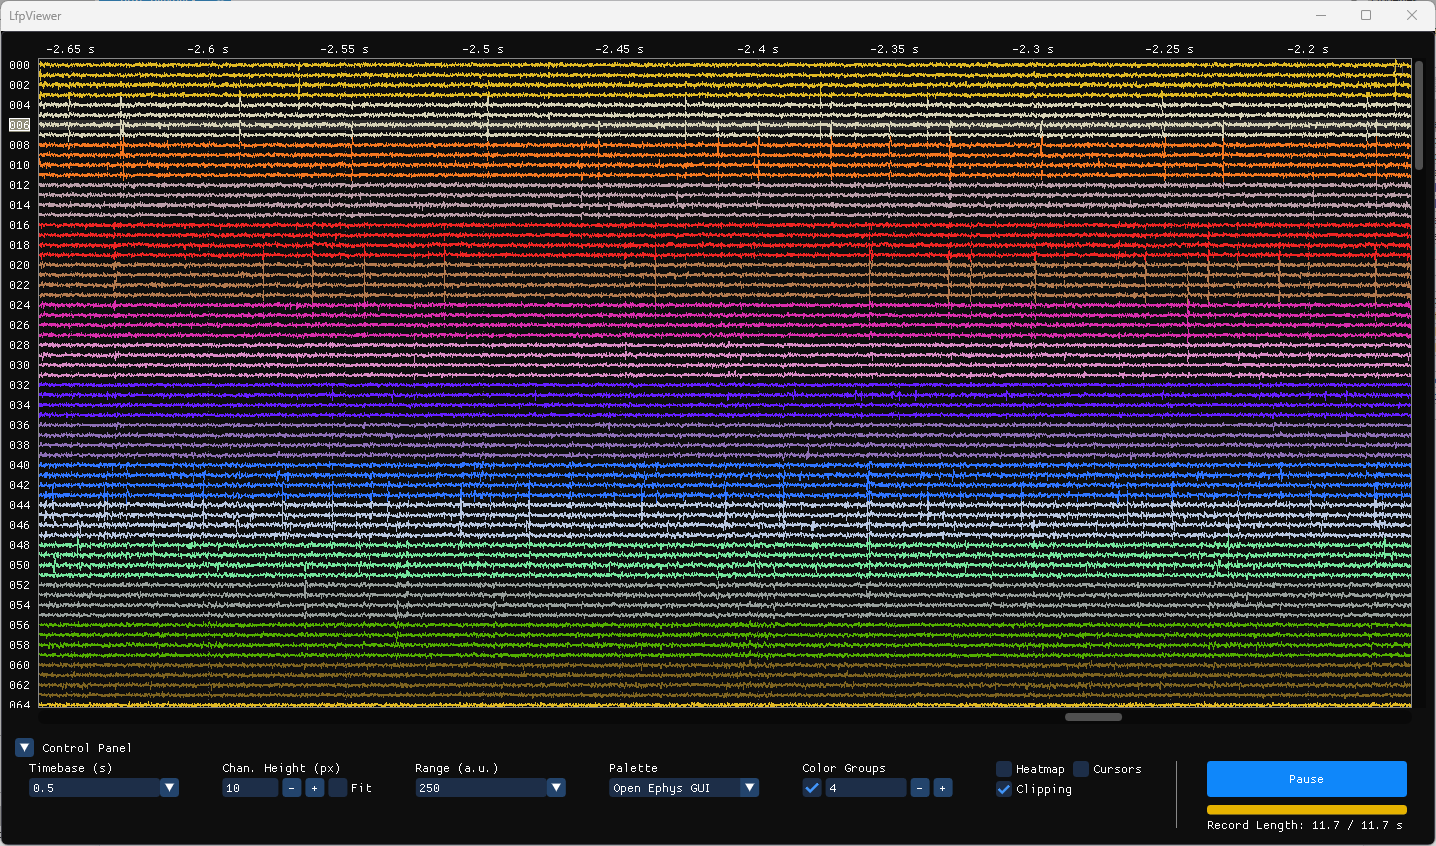
Reading the plot
The plot shows each channel as a trace, or as a row of color in the heatmap, against time. What is drawn in and around it in every view is described below, grouped by what it tells you. The expanded channel and the heatmap have sections of their own, Expanded channel and Heatmap.
Live and paused
When the display is live, new samples are written across the plot from left to right, in sweeps. At short timebases, where a sweep would be too fast to follow, each frame instead shows the last whole sweep, so the traces appear complete at once, as on a triggered scope (see How the display is drawn). When the display is paused, it holds still, and can be moved back through the record of recent signal ().
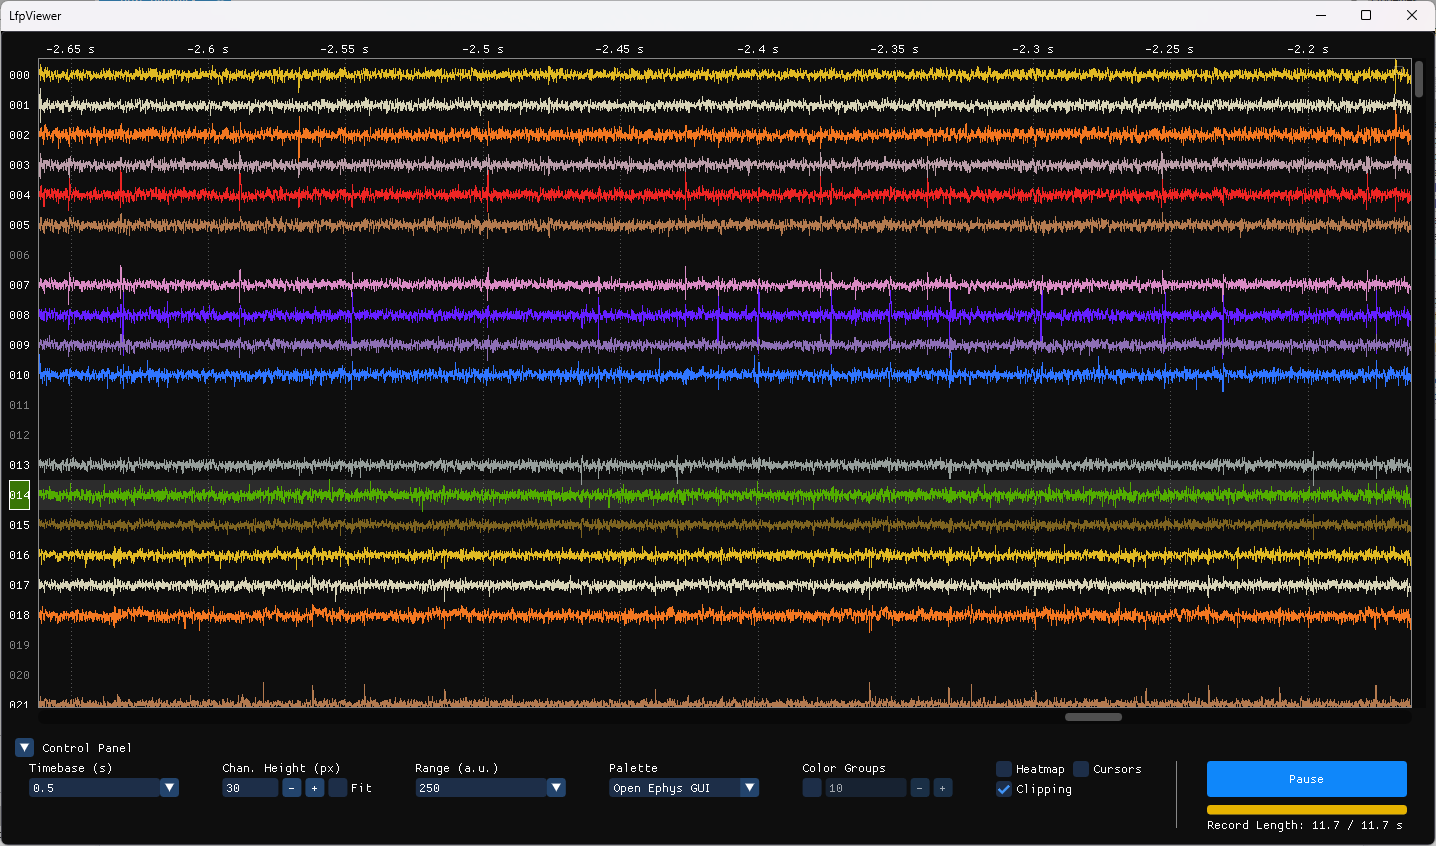
| Element | Description |
|---|---|
| Time labels | The time labels run above the plot. For live data, they show the time since the start of the sweep. When the display is paused, they show the time before the moment of pausing. |
| Sweep cursor | The sweep cursor is a yellow line. For live data, it marks where new samples are being written. When the display is paused, it marks where the display stopped. It is hidden while a sweep is too fast to follow, when the last whole sweep is shown instead (see How the display is drawn). |
| Frozen tail shading | When the display is paused, the part of the plot right of the sweep cursor, which shows the previous sweep, is darkened. |
| Time scroll bar | The time scroll bar below the plot shows where the screen sits in the record. While the display is paused, it can be dragged to move through time. |
| Divisions | Dim dotted lines divide the plot into ten divisions of time across it and, on an expanded channel, ten divisions of amplitude down it. |
Channels
Each channel has a row, labeled on its left. A channel can be hidden, selected for the cursors to read, and read under the pointer.
Clipping
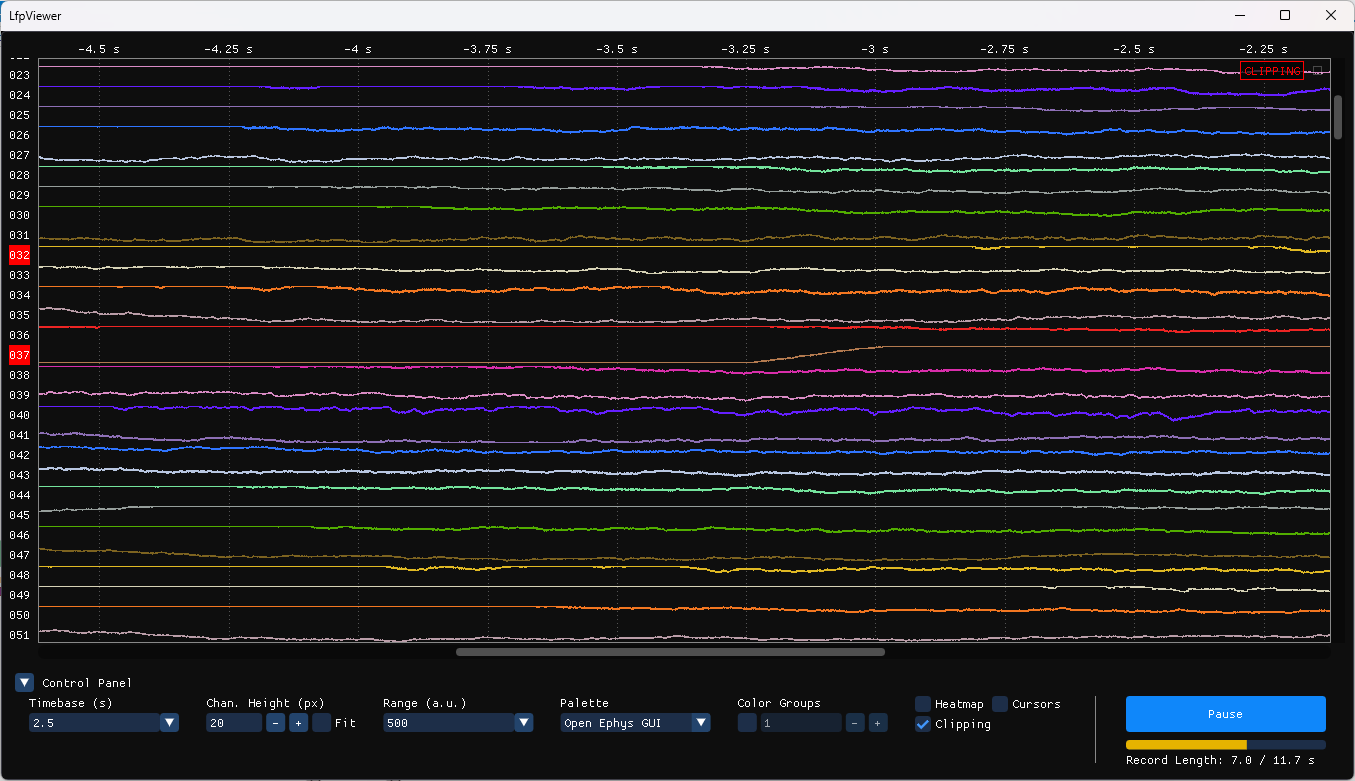
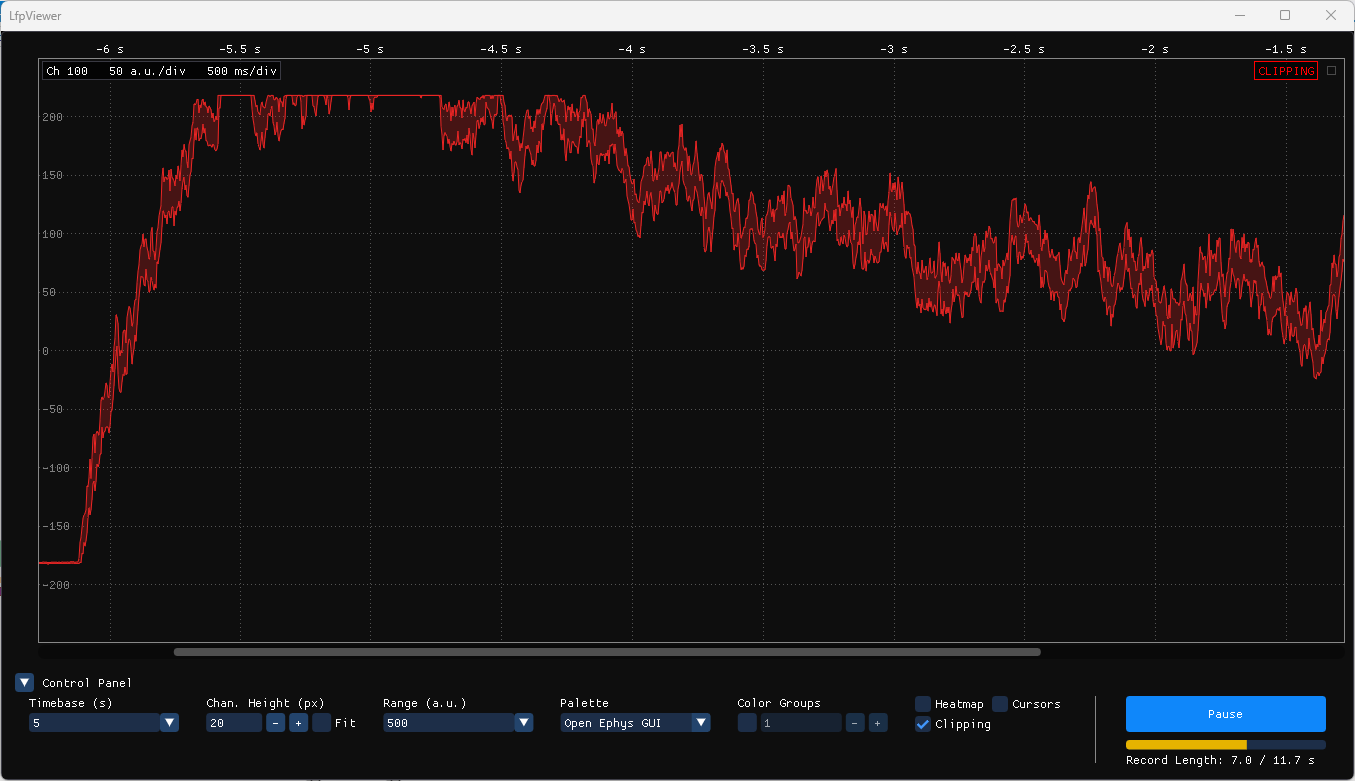
A channel clips when a sample reaches the node's saturation limits (see Input). While any channel has clipped within the last second of data, CLIPPING flashes in the plot's top right corner, beside the maximize button, and that channel's label flashes red in step with it, written even where labels are thinned out (). Clicking CLIPPING brings the first clipping channel to the middle of the plot, or expands it where a channel is expanded ().
Each channel's second starts again whenever it clips, and counts data, not wall time, so the marks also stay while no data arrives. When the display is paused, the marks stay as they were when it was paused and stop flashing, so the channels that were clipping stay marked, steadily, while the paused view is studied. Hidden channels raise no warning, so hiding a channel that is always clipping silences it, and the Clipping checkbox silences them all.
The examples below come from a live NeuropixelsV1 probe left floating, out of tissue, with its gain set to 3000 so that its channels would clip. That is not a sensible way to run a probe; it was done only to show the warning.
Maximize
The maximize button, in the plot's top right corner and faint until hovered, gives the plot the whole window, hiding the control panel. While the plot is maximized, the button shows the restore glyph, which brings the layout back. M does the same.
Expanded channel
An expanded channel fills the plot on its own, with an amplitude axis, so that one channel can be studied closely. Double-click a channel, or select it and press X, to expand it, and do the same to collapse it, which returns to the view from before the expand. While a channel is expanded, Q and E expand the previous or next channel in its place.
The expanded channel's row spans the range, as each row of the stacked view does, so a range set in one view holds in the other. Within the range, the view can be magnified and moved: the wheel moves it up and down the channel's amplitudes, Ctrl+Wheel magnifies it about the pointer, a right-drag zooms to a box, and a right double-click zooms all the way out (see Mouse). The view never shows more than the range. It belongs to the channel at that range, so expanding another channel, collapsing, or changing the range starts it over.
selects channels, expands them and zooms in on their spikes.
| Element | Description |
|---|---|
| Amplitude labels | Labels down the left of the plot give the amplitude of each division. |
| Channel name | The channel name in the top left of the plot gives the channel, the amplitude per division and the time per division. |
Heatmap
The heatmap draws each channel's row as a strip of color instead of a trace, which brings out activity spread across many channels. H, or the Heatmap checkbox, switches to it and back. In the heatmap, Color replaces Range in the control panel, and its bar also sets the threshold below which magnitudes are drawn black (see Color in Control panel). The heatmap has its own range, separate from the traces' range, because it usually reads best at a much smaller one. Double-click a row to read it as a trace at the traces' range, and double-click again to return.
uses the range and threshold to bring out spikes and slower waves in the heatmap.
| Element | Description |
|---|---|
| Colors | At each pixel of a row, the color shows whichever of the minimum and maximum lies further from zero, on the icefire colormap. The colormap is black at zero and brightens toward blue below and yellow above, with its ends at plus and minus the range. |
| Threshold | Magnitudes at or below the threshold are black, and those above it keep their usual color, so that only larger activity shows. |
| Rows | Rows sit exactly where the traces do, so switching views keeps every channel in place. |
| Offsets | A channel's offset shows as solid color, so remove it upstream, or with Offset where it is the same on every channel. |
Cursors
Up to four cursors measure time and amplitude on the selected channel ().
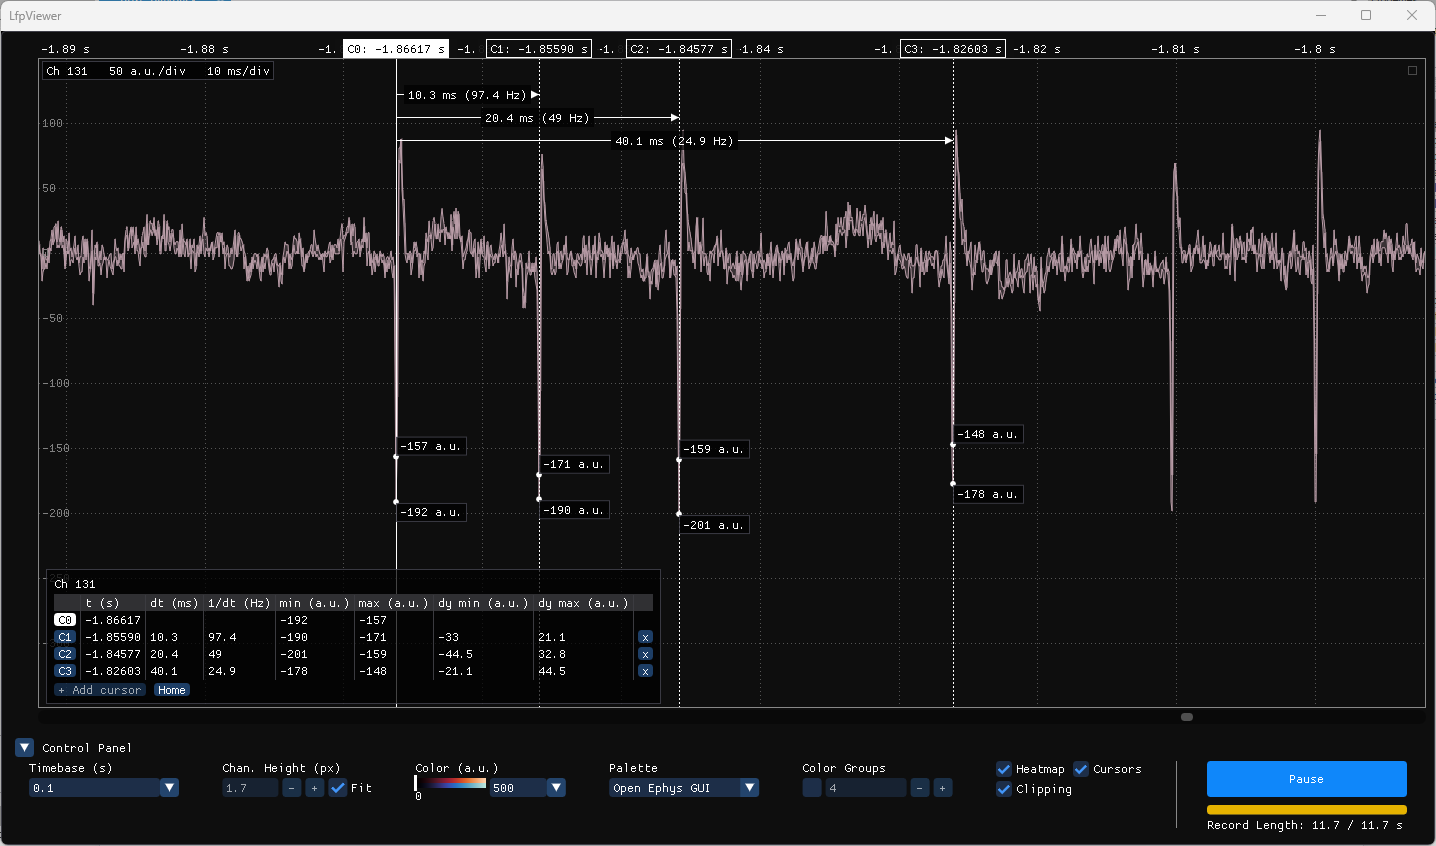
places cursors on the spikes of one channel and steps them onto their peaks.
| Element | Description |
|---|---|
| C0 to C3 | There can be up to four cursors, C0 to C3. C0 is always present while cursors are shown, and the others are added from the cursor table or with +. |
| Reference | The reference is the cursor the others are measured from, C0 to begin with. It is drawn as a solid line with a filled time label, where the others are dotted and outlined. Clicking a cursor's time label makes it the reference. The reference cannot be removed. |
| Active cursor | The active cursor is the one the Left and Right keys move, one pixel column at a time, or ten with Shift. A pixel column is one sample once the view is zoomed in to a sample per pixel, so a cursor can be stepped onto the tip of a spike. The active cursor is the one last dragged, picked by clicking its time label or its row in the cursor table, or added. Its row in the cursor table is highlighted, and where there is more than one cursor its line is drawn heavier. Removing the active cursor makes the reference active. |
| Time label | Each cursor's time label sits in the row of time labels, over any it would collide with, and gives the cursor's name and time. Clicking it makes that cursor the reference and the active cursor; where labels overlap, the one on top takes the click. |
| Selected channel | The cursors read the selected channel, which is chosen by clicking its trace or label, or with Q and E. Its label is boxed, and a faint band lies behind its row; in the heatmap, which would cover the band, white lines lie just above and below the row instead. With none selected, turning the cursors on or pressing X selects the first shown channel in view. Escape clears the selection, as does hiding the channel. |
| Markers and values | Where each cursor crosses the selected channel's trace, markers show the maximum above and the minimum below of what the pixel there is drawn from, or the single sample when the pixel holds one. In the heatmap there is no marker, and the one value the color shows is labeled level with the middle of the row. |
| Dimensions | Near the top of the plot, each cursor has a dimension line from the reference to it, with an arrowhead at the cursor. The line is broken around the time between them and its inverse in Hz, which sit on a dark fill so that they read over lines and graticules. |
Cursor table
The cursor table, in the lower left of the plot, gives each cursor's readings on the selected channel, one row per cursor ().
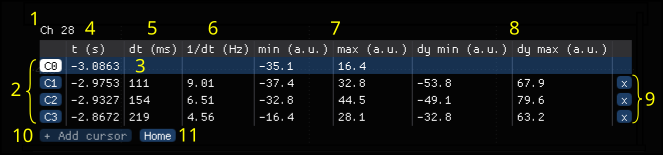
| Element | Description |
|---|---|
| 1. Channel label | The label gives the selected channel, which the cursors read, or No channel when none is selected. |
| 2. C0 to C3 buttons | While the display is paused, each cursor's button centers the screen on that cursor, which reaches a cursor that is off the screen. The reference's button is filled, as its time label is. |
| 3. Active row | The active cursor's row is highlighted. Clicking anywhere else on a row makes its cursor the active cursor. |
| 4. t (s) | This column gives each cursor's time in seconds, as its time label does. |
| 5. dt (ms) | This column gives each cursor's time from the reference in milliseconds, which is negative before the reference. It is blank for the reference itself. |
| 6. 1/dt (Hz) | This column gives the inverse of dt, in Hz, which is the frequency of a signal whose period spans the two cursors. |
| 7. min, max | These columns give the minimum and maximum of the samples the cursor's pixel column is drawn from, in the signal's units. At one sample per pixel, and always in the heatmap, the two are one value, and a single column, y, gives it instead. |
| 8. dy min, dy max | These bound how far the signal at a cursor may differ from the signal at the reference. A cursor reads what its pixel is drawn from, which spans the signal's minimum to maximum over the samples it covers, so the true difference between the two cursors lies somewhere from dy min (this cursor's minimum less the reference's maximum) to dy max (this cursor's maximum less the reference's minimum). The range narrows as zooming in puts fewer samples in each pixel. At one sample per pixel, and always in the heatmap, the two are equal, and a single column, dy, gives the difference instead. |
| 9. x | The x button removes that cursor. The reference has none, since it cannot be removed. |
| 10. + Add cursor | This button adds a cursor in the middle of the screen and makes it the active cursor. It is disabled at four cursors. |
| 11. Home | Home brings the cursors to the middle of the screen, keeping their spacing, or spreads them evenly if they span more than the screen. |
How the display is drawn
This section describes what the viewer does with the signal it is given. None of it changes the signal itself.
| Step | Description |
|---|---|
| History | Every sample is kept in a record of recent signal, sized by HistorySize, from which a paused view is redrawn. The record is not written while the display is paused, and is cleared when it resumes. |
| Decimation | Each channel's sweep is divided into columns, as many as the widest monitor has pixels across, each keeping the minimum and maximum of the samples it covers. At short timebases, where a sweep spans fewer samples than that, a column holds a single sample. |
| Drawing | Columns are combined to one per pixel of plot width, again as minimum and maximum, and each pixel column is drawn as a span between them. Which columns a pixel combines is counted from the start of the sweep, not the edge of the screen, and a paused view pans a whole pixel at a time, so panning never regroups them, and a pixel, and a cursor reading it, keeps its value. Each pixel's span reaches to its neighbor's so that steep steps stay joined. Where there are fewer columns than pixels, the samples are interpolated into a line. The traces are drawn into an image, and while the display is live, only the columns the sweep crossed since the last frame are redrawn. The hovered or expanded channel's outline is drawn over the image every frame. |
| Fast sweeps | When a sweep lasts 10 refreshes of the display or fewer (timebases of 100 ms or less on a 100 Hz display, about 167 ms at 60 Hz), each frame shows the last whole sweep rather than the one in progress. Drawn in so few steps, a sweep would read as jumps rather than motion, and at the fastest it would alias against the frame rate. |
Single channel
With one channel, the viewer always shows it expanded (see Expanded channel), and it cannot be collapsed (). Chan. Height, Fit and Heatmap arrange a stack of channels, so they are disabled, and their keys do nothing. Everything else, the expanded channel's amplitude zoom included, works as usual.
The workflow below makes one: it generates a sine wave with FunctionGenerator, as 8-bit samples at 44.1 kHz, so it needs no hardware or recording.