OpenEphys.EphysVisualization
OpenEphys.EphysVisualization is a Bonsai library of visualization tools for electrophysiology, maintained by Open Ephys. It covers both the display of recorded signals and the interfaces used to configure acquisition instruments, and draws them with Dear ImGui and OpenGL.
Documentation
- Waveform Scope describes the WaveformScope node and everything its display can do.
- Probe Selector describes the probe selector, its gestures and rulers, and how to host it.
- The API reference lists every public type, for building on the library.
What's in the package
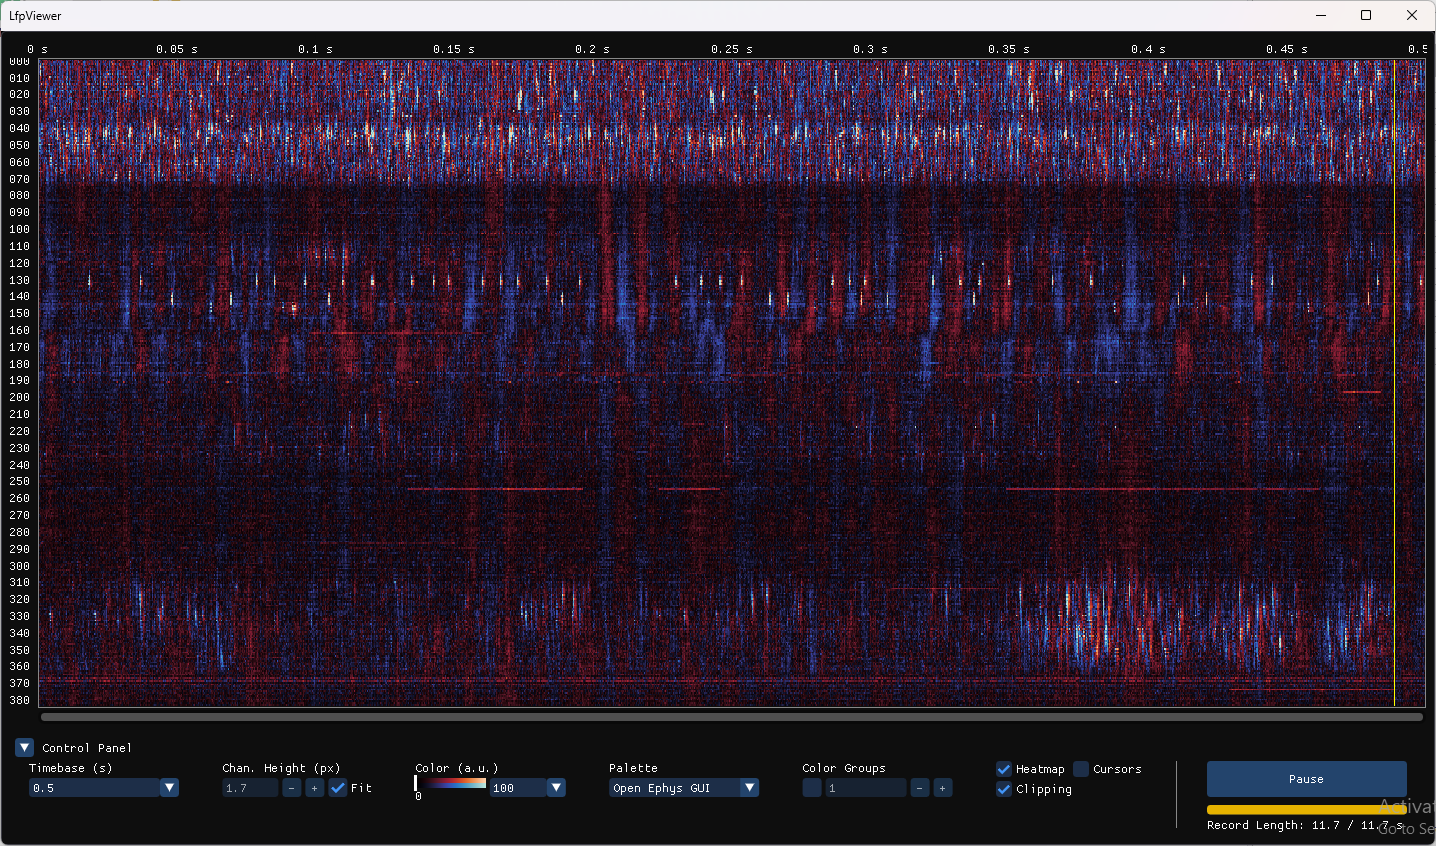
- WaveformScope shows a sequence of channel-by-sample matrices as a live multichannel waveform display, with a heatmap, cursors, clipping detection, and a record of recent signal that can be paused and moved back through.
- WaveformScopeBuilder<TSource> and WaveformScopeVisualizerBase are the base other packages build waveform viewers for their own data on.
- ImGuiProbeSelector draws a minimap and a zoomable view of a probe described by a ProbeInterface file, with contact selection.
- ImGuiWidgets, ImGuiPalette and ImGuiColormapRangeSlider give Open Ephys instrument configuration interfaces their shared widgets and look, and ImGuiGLControl hosts an ImGui context in a WinForms control.
Requirements
The library runs on Windows with OpenGL 3.3 or later. A package that draws with ImGui alongside it must reference the same version of Hexa.NET.ImGui, since ImGui types appear in this library's API.
Acknowledgments
The waveform scope grew out of the WaveformVisualizer in Bonsai.Ephys.
The colors of channel groups are Glasbey's category10 palette from colorcet, licensed under CC BY 4.0, with its grey and its darkest colors left out.