
Miniscope GUI Reference#
This page describes every control in the Open Ephys Miniscope V4 GUI. For installation and a first acquisition walkthrough, see Installing and Using the GUI.
The window is divided into six regions:
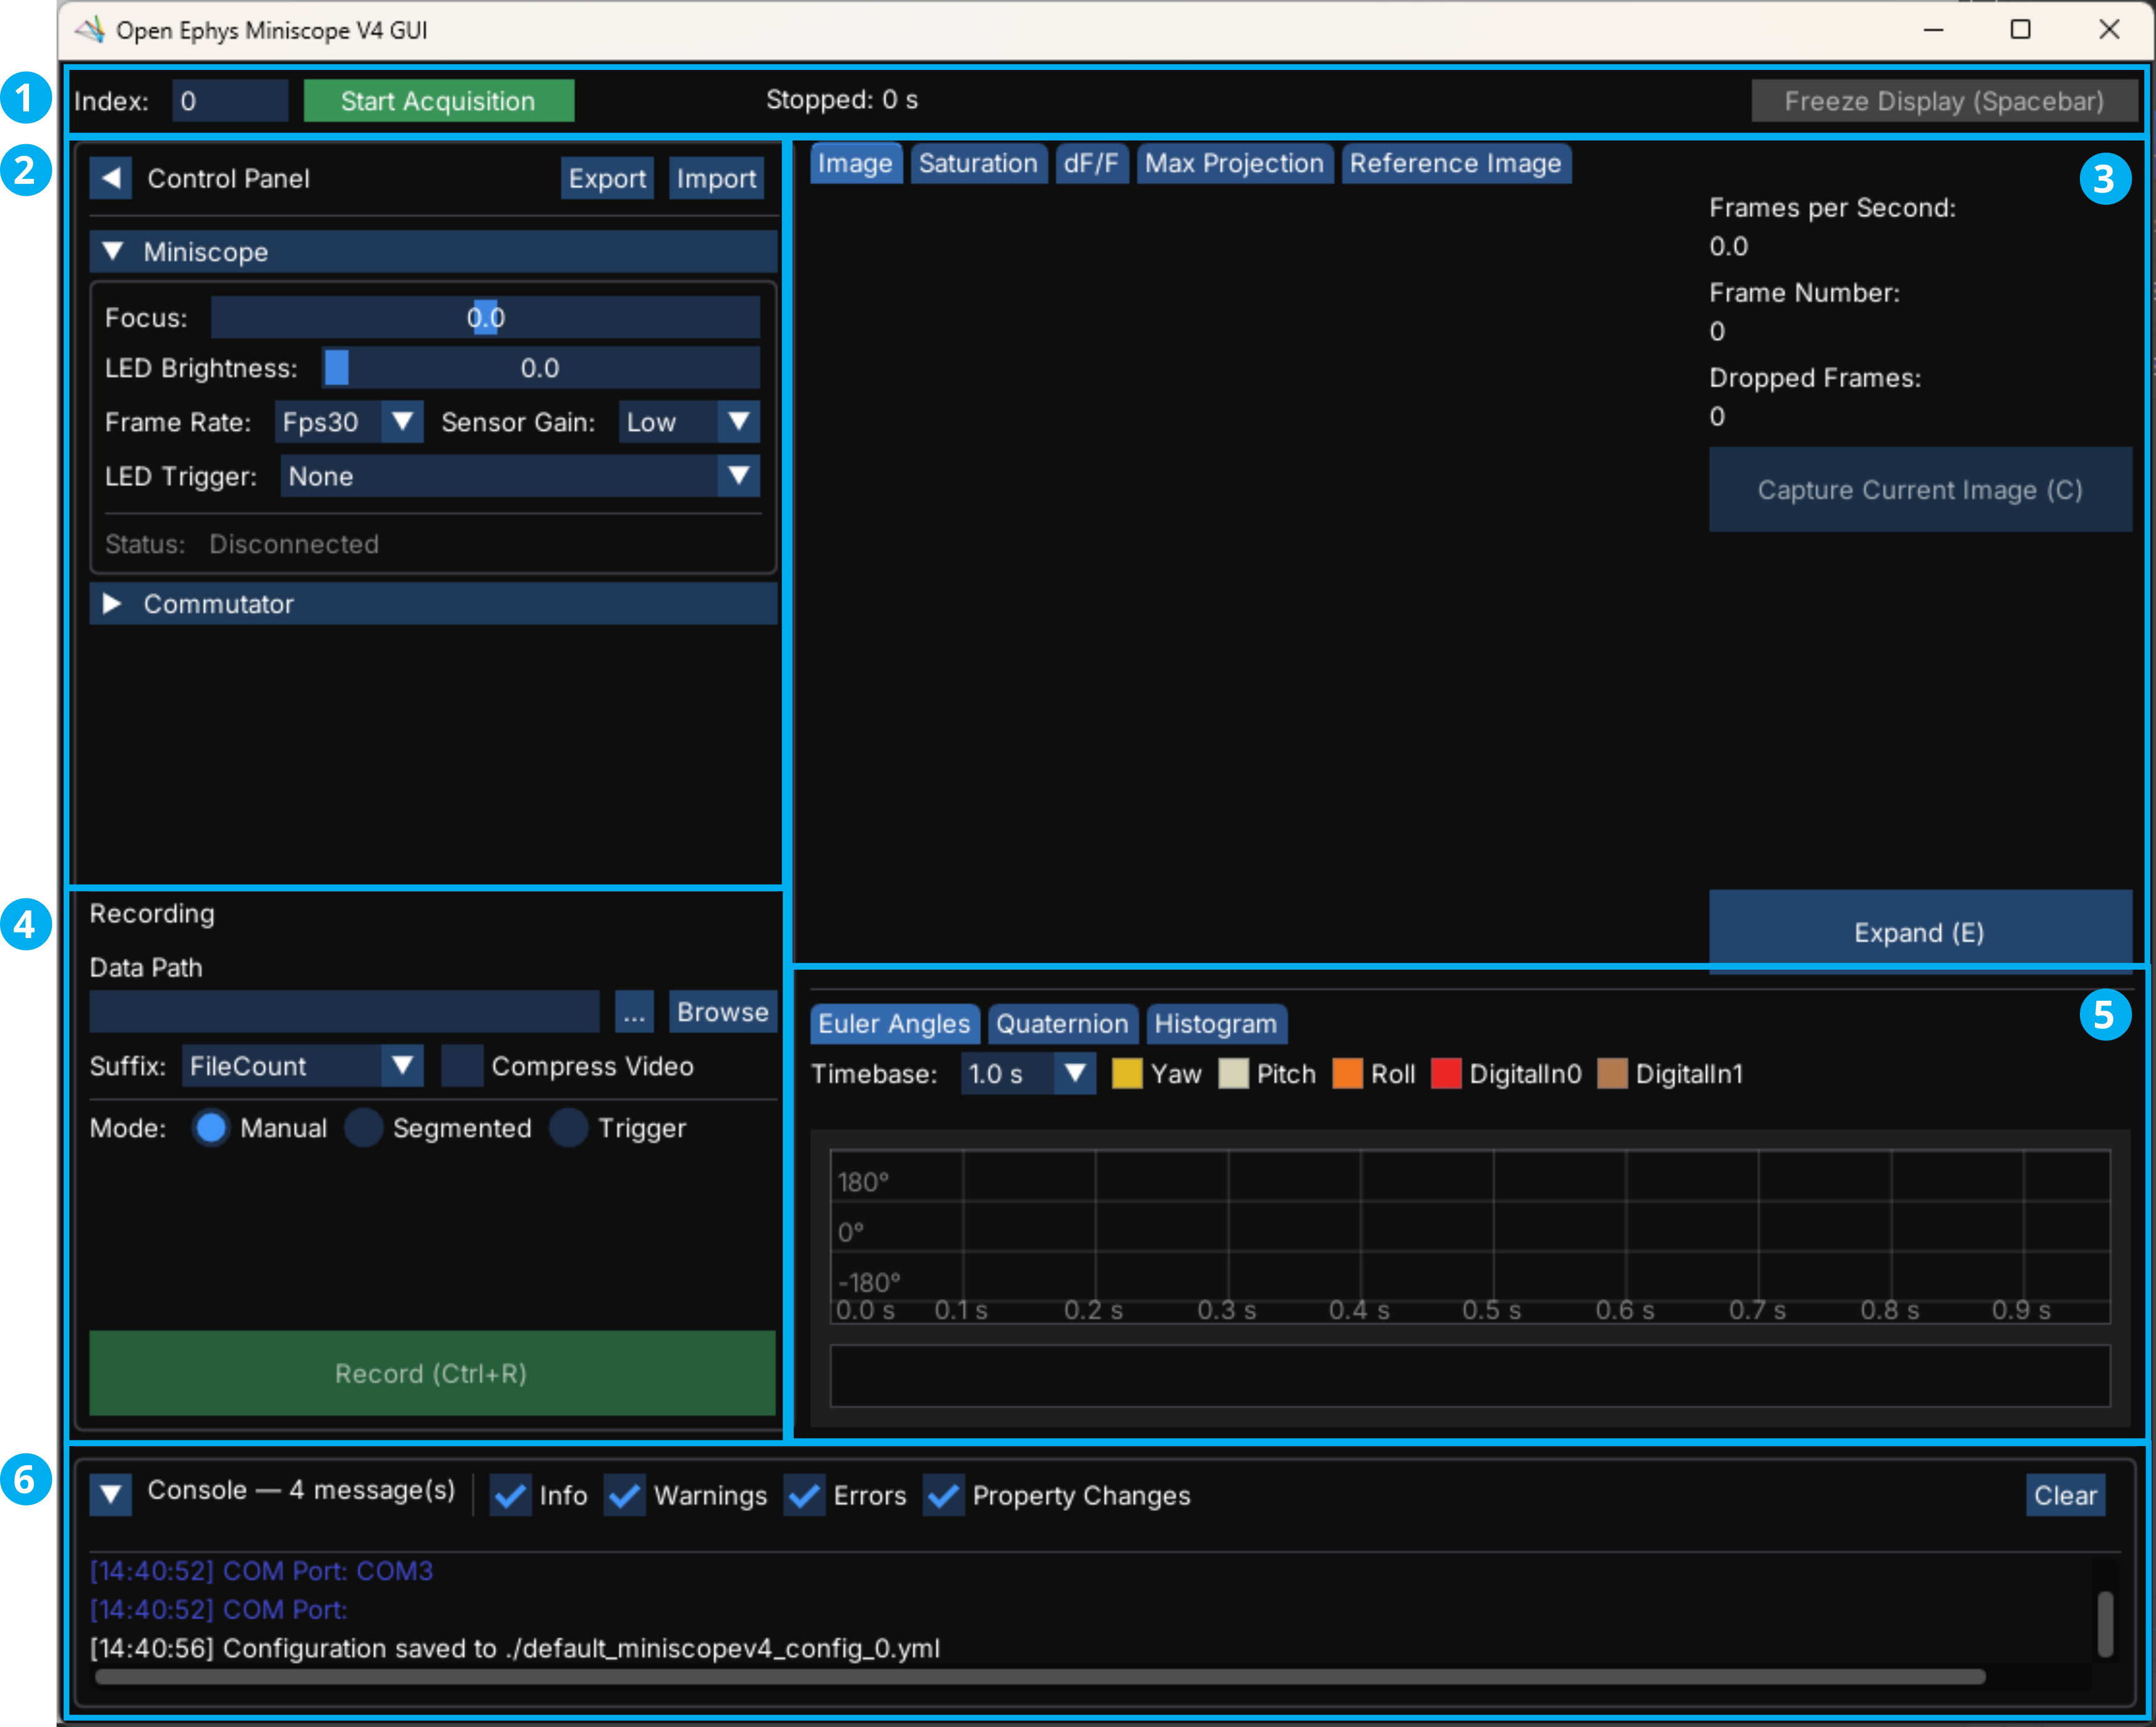
The status bar across the top, which selects the Miniscope index and starts and stops acquisition.
The control panel on the left, holding the Miniscope and commutator hardware settings.
The image tabs of the data panel, showing the live image and basic visualizations of the image.
The recording section, anchored to the bottom of the control panel.
The signal tabs of the data panel, plotting orientation, digital inputs, and the pixel intensity histogram.
The console along the bottom, logging information about GUI events.
Both the control panel and the console can be collapsed with the arrow button in their corner, and the boundaries between the image pane, the signal pane, and the console can be dragged to resize them.
Tip
Every control in the GUI has a tooltip. Hover over a control to see what it does, the valid range of its values, and its keyboard shortcut if it has one. If the control is greyed out, the tooltip will also display the reason why it is currently unavailable.
Keyboard Shortcuts#
These shortcuts work anywhere in the GUI, regardless of which tab is open, and are ignored while the cursor is in a text field.
Key |
Action |
|---|---|
Ctrl+R |
Start or stop recording (arm or disarm in Trigger mode). |
Space |
Freeze or resume the live display, without affecting acquisition or recording. |
C |
Capture the current image to the data folder. |
E |
Expand the image to fill the window, or collapse it back. |
Shift + mouse wheel |
Step the time-series timebase up or down. |
Ctrl+C |
Copy the selected console messages to the clipboard. |
A few other shortcuts only apply on a specific image tab, and are documented alongside the control they belong to.
Status Bar#

- Index:
The index of the Miniscope to acquire from, in the order the cameras are detected by the computer, where
0is the first camera. If several Miniscope DAQs are connected, step through the indices to find the one that corresponds to your Miniscope. This cannot be changed while acquiring. There is no way to tell which index corresponds to which physical Miniscope ahead of time: with more than one connected you have to try each index in turn.- Start / Stop Acquisition:
Starts and stops streaming frames from the Miniscope. Most other controls only become available once acquisition is running. If Auto Connect is checked in the Commutator section but no commutator has been found, this button is unavailable, because that setting makes the commutator required for acquisition.
- Timers:
Acquiring counts the seconds since acquisition started (and shows Stopped with the duration of the last run when idle). Recording counts the seconds since the current recording began.
- Freeze / Resume Display:
Freezes the live image and the time-series plots so a transient event can be inspected. Acquisition and recording continue unaffected; nothing is lost while the display is frozen. While frozen, the time-series plots become interactive: click and drag to scroll back through the buffer, and use the mouse wheel to zoom. Shortcut: Space.
Control Panel#
The control panel holds all hardware settings. Collapse it with the arrow button next to its title to give the data panel the full window width; click anywhere in the collapsed strip to bring it back.
Any change to a hardware setting is recorded in the console as a Property Change, so the log is a complete record of what was changed and when.
Import and Export#
The Export and Import buttons at the top of the panel write and read the full GUI configuration as a YAML file: Miniscope settings, commutator settings, display settings, and file settings all together. Use these to move a configuration between machines or to load the settings from a previous experiment. See Configuration Files for the file format.
Miniscope#
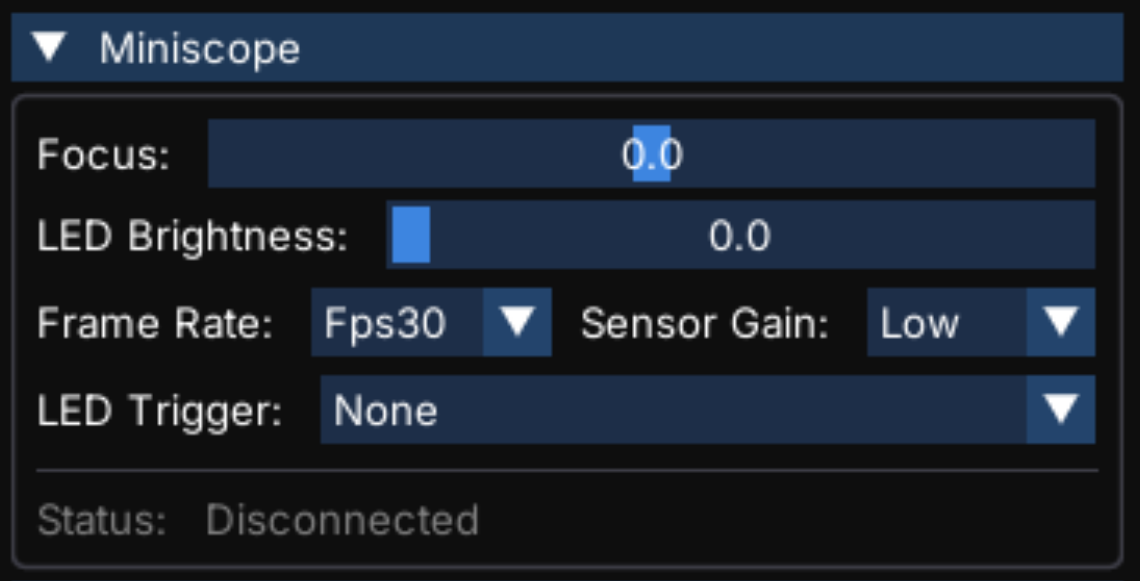
- Focus:
Adjusts the electrowetting lens (EWL) around its nominal focal plane, from -100% to 100%. The relationship between this percentage and the resulting focal plane shift is non-linear.
- LED Brightness:
Sets the excitation LED level as a percentage of maximum current, from 0% to 100%. The relationship between this percentage and radiance is non-linear.
- Frame Rate:
The number of frames the Miniscope acquires per second. This cannot be changed while recording, because the recorded video file is written at a fixed frame rate.
- Sensor Gain:
The image sensor’s analog gain.
- LED Trigger:
Gates the excitation LED with one of the Miniscope DAQ’s digital inputs: the LED turns on only while the selected input is high. Set to
Nonefor a continuously-on LED. Gating the LED to a trigger reduces photobleaching during long sessions with intermittent recordings, at the cost of not being able to monitor activity between recordings. This is independent of Trigger recording mode — the two can be, but are not necessarily, driven by the same input.- Status:
Acquiring while frames are streaming, Disconnected otherwise.
Commutator#
These settings control an Open Ephys torque-free commutator , which rotates the coaxial tether to counteract the twist accumulated as the animal turns. A commutator is not required to operate the Miniscope; see Coaxial Commutator for the hardware and the commutator documentation for how to mount and connect it.
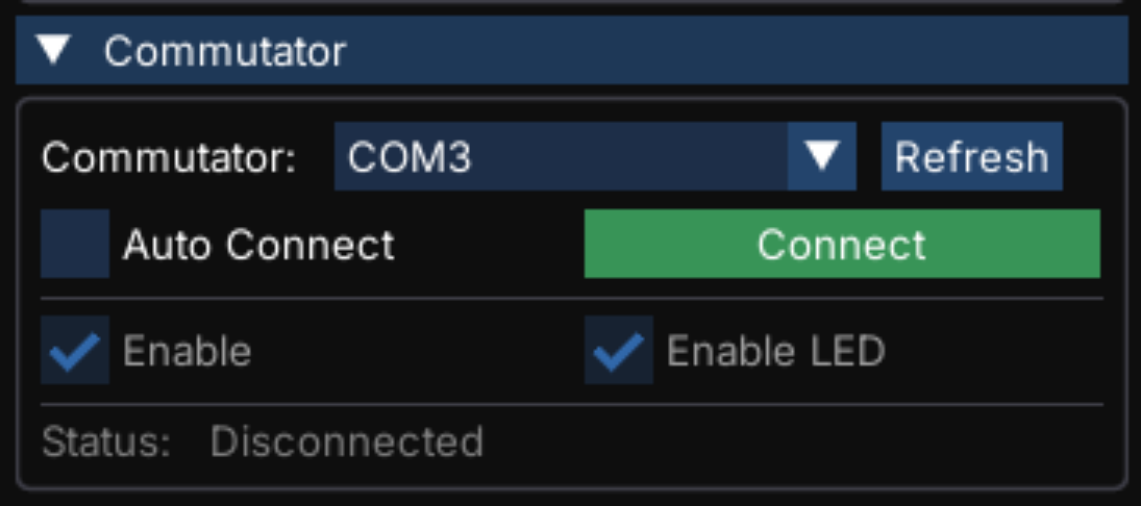
- Commutator:
The serial port Windows assigned to the commutator’s USB connection.
- Refresh:
Rescans the serial ports. The GUI does not list every COM port on the machine: it probes each one and keeps only those that answer with a valid commutator response, so anything appearing in the dropdown is a commutator. If the list is empty, check the USB cable and click Refresh again. Note that a recently plugged-in commutator charges its internal capacitors before it will respond to commands, which can take up to 30 seconds; if it does not appear in the list, wait for its status LED to stop indicating charging and click Refresh again.
- Auto Connect:
Connects the selected commutator automatically when acquisition starts, and makes the commutator required for acquisition: Start Acquisition is unavailable while no commutator has been found, and any commutator error stops acquisition. Use this when a session is not worth running without commutation, so a commutator that fails partway through cannot leave you with a recording of a tangled tether.
The checkbox itself is always available, whether or not a commutator has been found, so it can be set before the commutator is plugged in. Leave it unchecked to run the Miniscope without a commutator.
- Connect / Disconnect:
Opens or closes the connection to the selected commutator. The port cannot be changed while connected. Disconnect is unavailable while acquisition is running with Auto Connect checked, since the commutator is required; uncheck Auto Connect first to disconnect without stopping acquisition.
- Status:
Connected once the commutator is connected, Disconnected otherwise, and Connecting… or Disconnecting… while a connection is being opened or closed.
- Enable:
Enables the commutator motor so it counteracts cable twist as the animal rotates. The commutator is driven by the same quaternion orientation data plotted in the Quaternion signal tab.
- Enable LED:
Turns on the commutator’s indicator LED.
Note
The GUI drives the commutator directly from the Miniscope’s on-board IMU. The equivalent hand-built workflow, including manual keyboard control of the commutator, is described in Automate tether commutation using 3D orientation data.
Recording#
The recording section stays anchored to the bottom of the control panel. It is described in full in Recording Data with the Miniscope GUI.
Image Tabs#
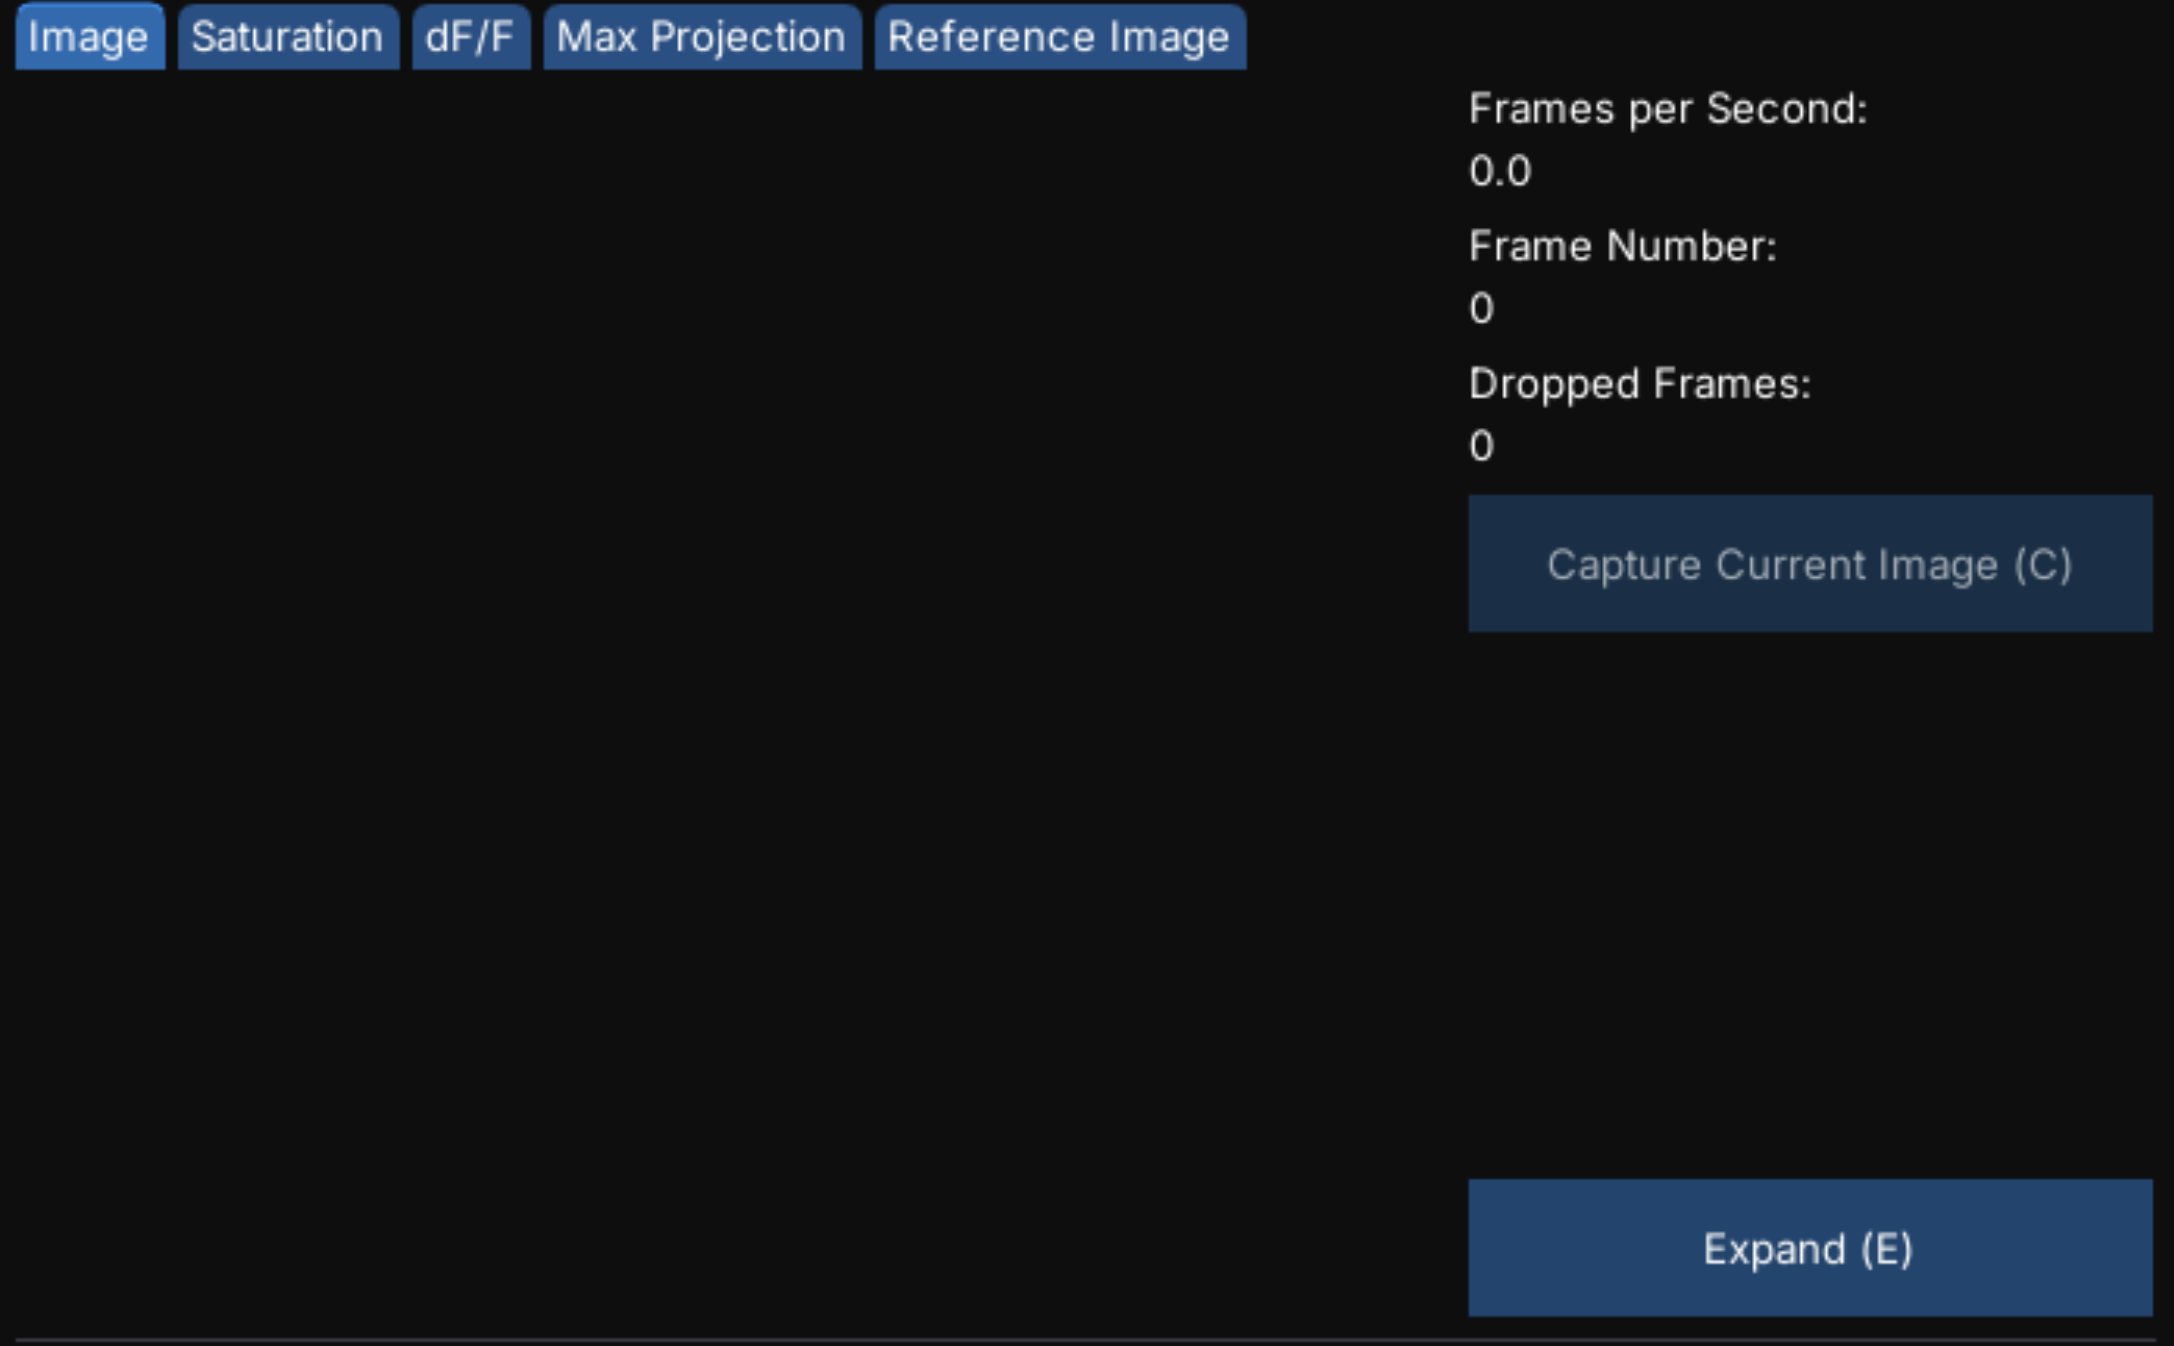
The image tabs all show the same live frame, processed differently. Each tab has a control column on its right with the settings for that view, and an Expand button (E) that grows the image to fill the entire window, hiding the control panel, the signal plots, and the console. Press E again, or click Collapse, to restore them.
Note
These views are display-only. The data written to file is always the raw sensor image. None of the processing below is saved in the recording.
Image#
The raw image from the sensor, with the acquisition statistics alongside it:
- Frames per Second:
The measured frame rate. Compare this to the Frame Rate setting to confirm the system is keeping up.
- Frame Number:
The frame counter reported by the Miniscope.
- Dropped Frames:
The number of frames lost since acquisition started, shown in red once it is non-zero. Dropped frames usually indicate a USB bandwidth problem. Use a USB 3.0 port directly rather than through a hub, and a high-speed cable shorter than 2 meters if possible.
- Capture Current Image:
Saves the current frame as a PNG next to the recording data, named
<base
name>frame_<frame number>_<yyyyMMdd_HHmmss_fff>.png
. Requires acquisition to be running and a data path to be set. Shortcut: C.
Saturation#
Highlights pixels whose intensity exceeds a threshold, so over-exposure can be spotted at a glance.
- Threshold:
Pixels above this intensity, from 0 to 254, are highlighted.
- Color:
The highlight color. Click the swatch to change it.
Use this together with the Histogram signal tab while setting LED brightness and sensor gain.
dF/F#
A naive, causal \(\Delta F/F\) computed over the incoming sequence of images, which suppresses the static background and makes transient activity much easier to see while positioning the Miniscope.
- Background frames:
The number of previous frames averaged to estimate the background fluorescence, from 2 to 1000. More frames give a more stable baseline but a slower response to changes in the field of view.
- Background threshold:
The minimum background intensity, from 0 to 255, required before \(\Delta F/F\) is computed for a pixel. This keeps dark, noise-dominated pixels from producing large spurious ratios.
- Sigma (px):
The standard deviation, in pixels, of the Gaussian blur applied before computing \(\Delta F/F\). Set this to roughly the spatial extent of a region of interest (e.g., a cell body) to smooth out pixel-level noise. Set to 0 to disable blurring.
Warning
This is a display aid for finding cells during setup, not an analysis result. Use a dedicated analysis pipeline on the recorded video for quantitative work; see How Do I Analyze My Data?.
Max Projection#
Accumulates the maximum value each pixel has reached, continuously, since the last reset. Because active cells are bright at some point in time and the background is not, a max projection accumulated over tens of seconds gives a good map of the cells in the field of view.
- Reset:
Clears the accumulated projection and starts building it again from the current frame. Shortcut: R.
Reference Image#
Overlays the live image on a static reference image in two different colors, so the current field of view can be aligned with a previous one. This is how you return to the same field of view across sessions: capture an image at the end of one session, then load it as the reference at the start of the next and adjust the Miniscope until the two colors line up.
- Reference Image:
The path to the reference image. Click Select to choose an image saved earlier with Capture Current Image, Clear to remove the current path (for example if the file was since moved or deleted), or Browse to open the data folder in File Explorer to check out all saved images.
- Apply Live Overlay:
Blends the live image into the view. With this off, only the reference image is shown. Unavailable until a reference image is chosen. Shortcut: O.
- Reference Color:
The color used to tint the reference image.
- Live Color:
The color used to tint the live image.
Signal Tabs#
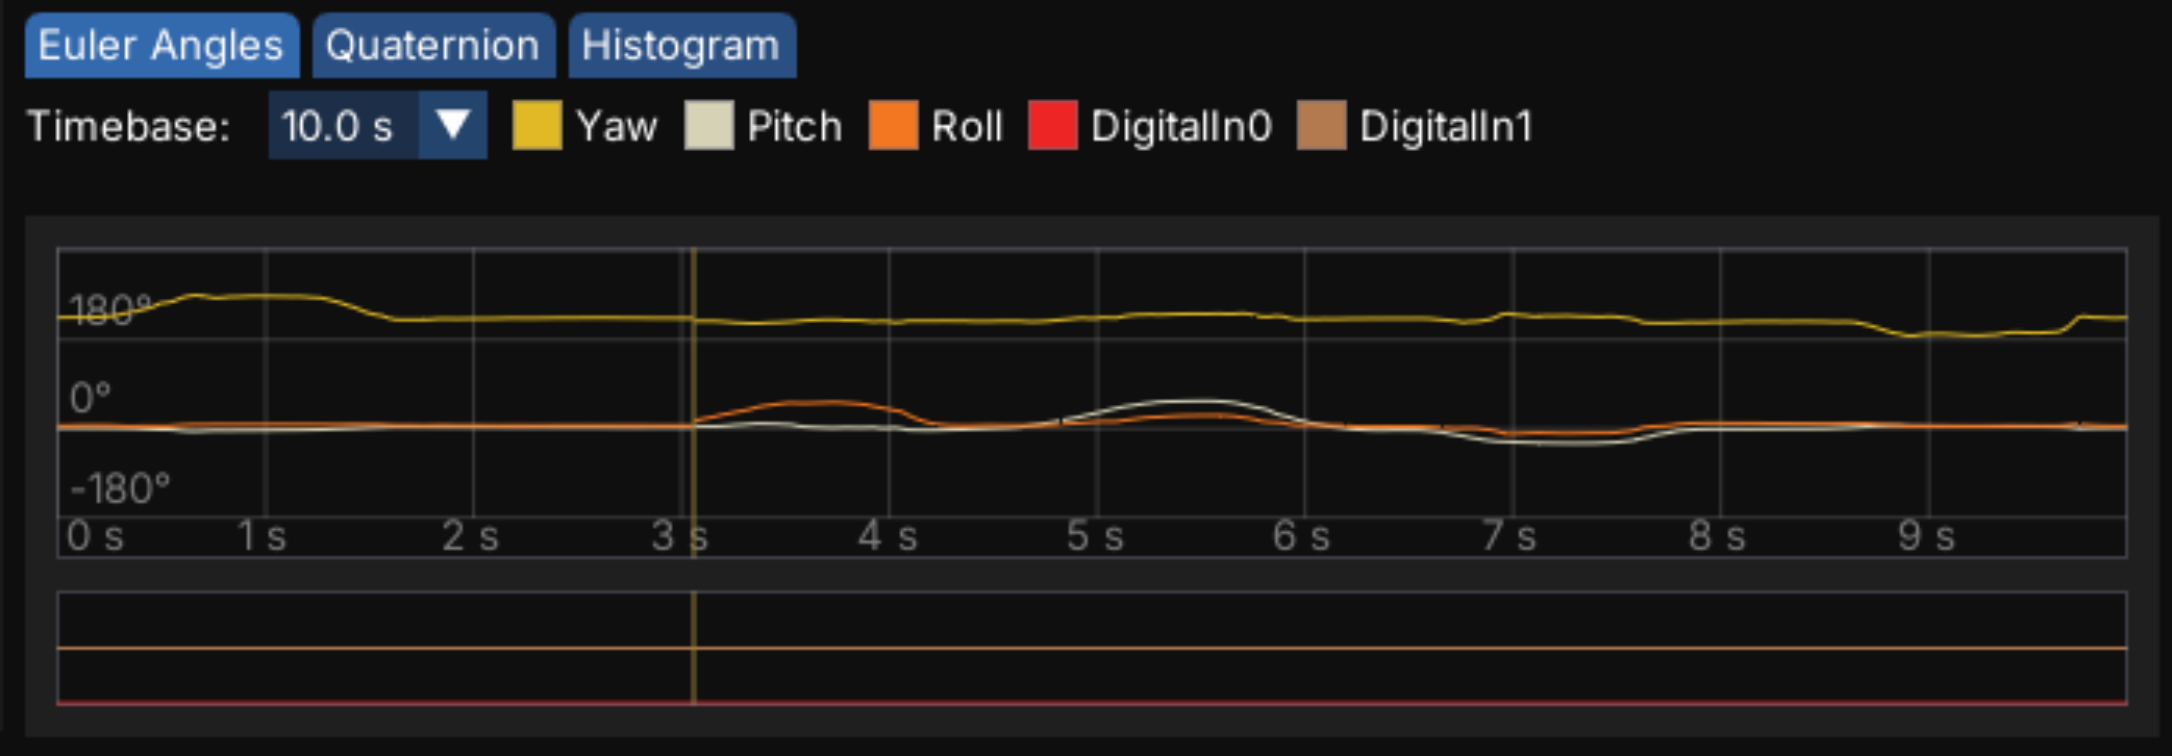
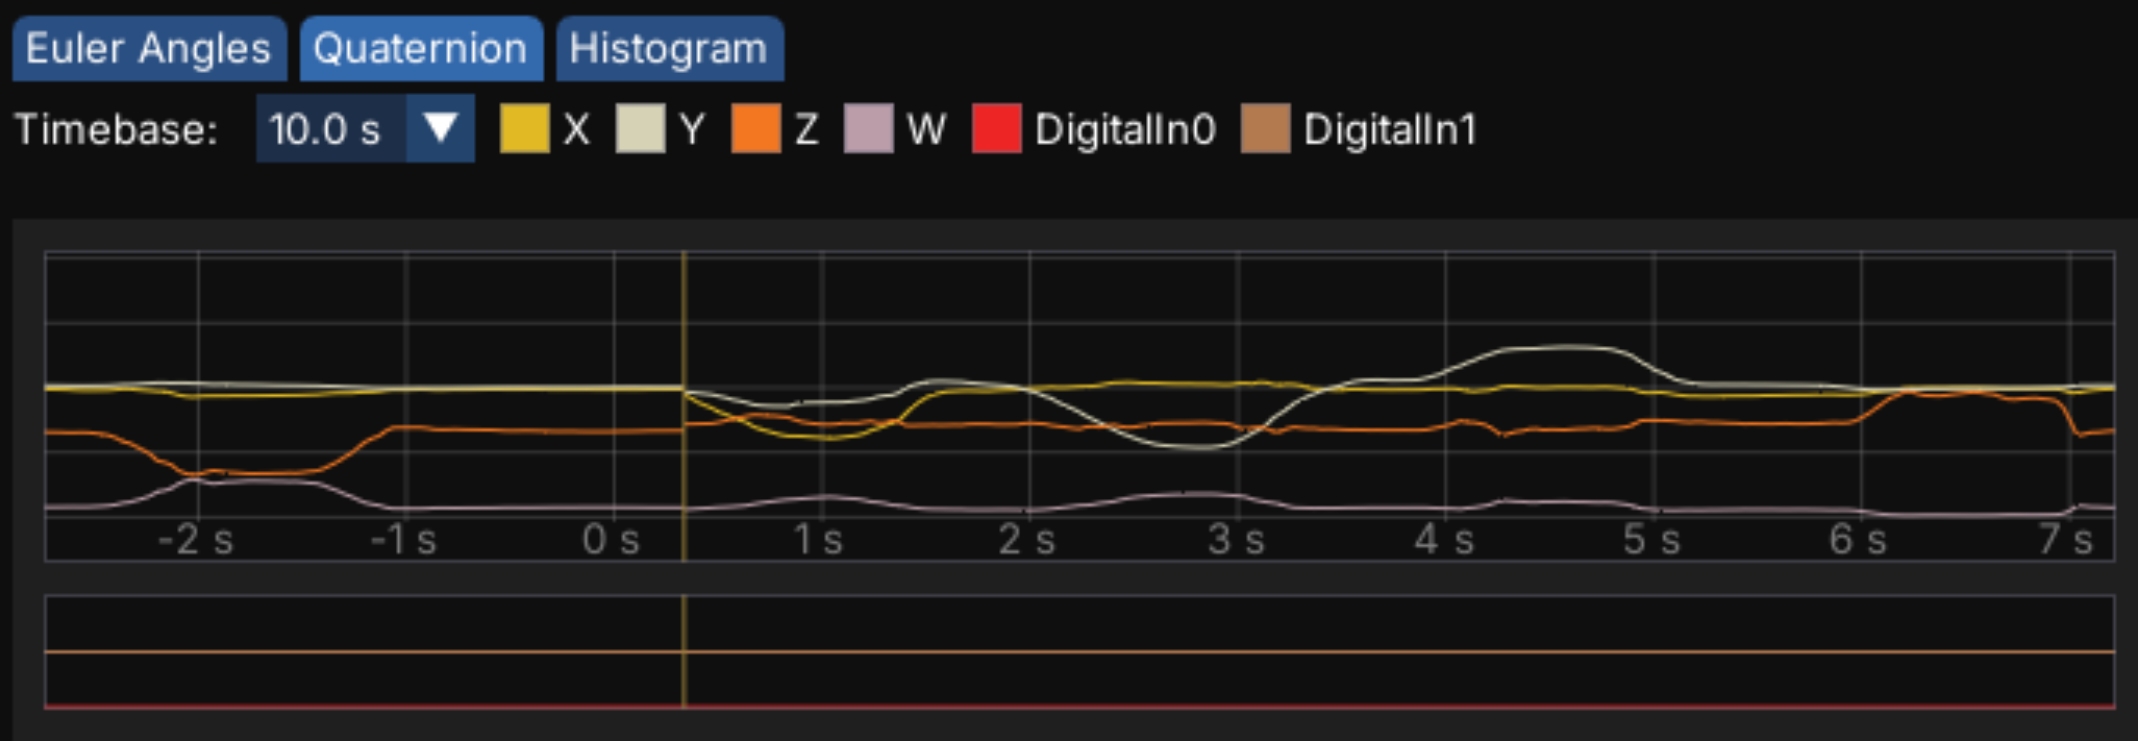
The signal tabs plot the non-image data streaming from the Miniscope. Euler Angles and Quaternion show the Miniscope’s orientation as a time series; Histogram shows the distribution of pixel intensities in the current image.
The two time-series tabs each have an independent Timebase control that sets how many seconds of data are shown, and a clickable legend. Click a colored swatch to show or hide that trace. The timebase options available depend on the frame rate.
A yellow vertical line marks the current write position: traces to its left are the most recent samples, and the data sweeps across the plot rather than scrolling.
Tip
Shift + mouse wheel steps the timebase up and down without opening the dropdown. Freeze the display with Space to make the plots interactive, then drag to scroll back through the buffer and use the mouse wheel to zoom.
Euler Angles#
The Miniscope’s orientation as Yaw, Pitch, and Roll in degrees, following the Tait-Bryan formalism. This is generally the easier of the two orientation views to interpret by eye.
Quaternion#
The raw quaternion (X, Y, Z, W) reported by the Miniscope’s on-board IMU. This is the data used to drive an attached commutator. To learn more about interpreting quaternion data, see the IMU Data article in the Open Ephys Wiki.
Digital Inputs#
This is not a tab of its own: both orientation tabs carry a second plot beneath the
orientation traces, showing the state of the Miniscope DAQ’s digital inputs, DigitalIn0
and DigitalIn1, on the same time axis. This is how you verify that a trigger source is
actually reaching the DAQ, and where you can see the relationship between an external
trigger and the recorded data, if any.
Histogram#
The distribution of pixel intensities across the current image, normalized so the tallest bin fills the plot. It shows the relative distribution of pixel values, not the number of pixels at each intensity. Use it to set exposure: a histogram bunched against the right edge means the image is saturating.
Console#
The console records everything the GUI does: recordings started and stopped, files written, hardware settings changed, warnings, and errors.

- Filters:
Info, Warnings, Errors, and Property Changes checkboxes show and hide each category of message. Warnings appear in yellow, errors in red, and property changes in blue.
- Selection:
Click a message to select it, Ctrl-click to add to the selection, and Shift-click to select a range. Press Ctrl+C, or right-click and choose Copy Selected or Copy All, to copy messages to the clipboard. Useful when reporting a problem, or for saving messages that occur outside of recordings.
- Clear:
Removes all messages from the console. This does not affect messages already written to a recording’s log file.
Collapse the console with the arrow button in its corner, or drag its top edge to resize
it. While a recording is running, every console message is also written to that
recording’s .log file; see The Files a Recording Produces.