Exploring the user interface#
Functionally, the GUI is very similar to traditional programs for acquiring extracellular electrophysiology data. It allows you to configure input sources, adjust filter settings, visualize spikes and LFPs, and save all of your data to disk. Conceptually, however, the GUI is more similar to audio processing applications, such as Ableton Live. Rather than hard-coding the signal chain, the processing pathway can be created dynamically by the user. This feature will hopefully make the GUI easier to comprehend, less painful to modify, and more enjoyable to use. While most open-loop electrophysiology experiments require roughly the same signal chain, closed-loop experiments rarely do. A more flexible user-interface also allows neuroscientists to build up a library of plugins that can be re-used and shared, rather than relying on purpose-built code in Matlab or LabVIEW that’s used for one experiment then scrapped.
Main components#
The GUI is designed to ensure all of the most important elements are accessible from a single window, to keep everything organized. However, many components can also be collapsed when they are not in use.
These are the components you’ll be interacting with most often:
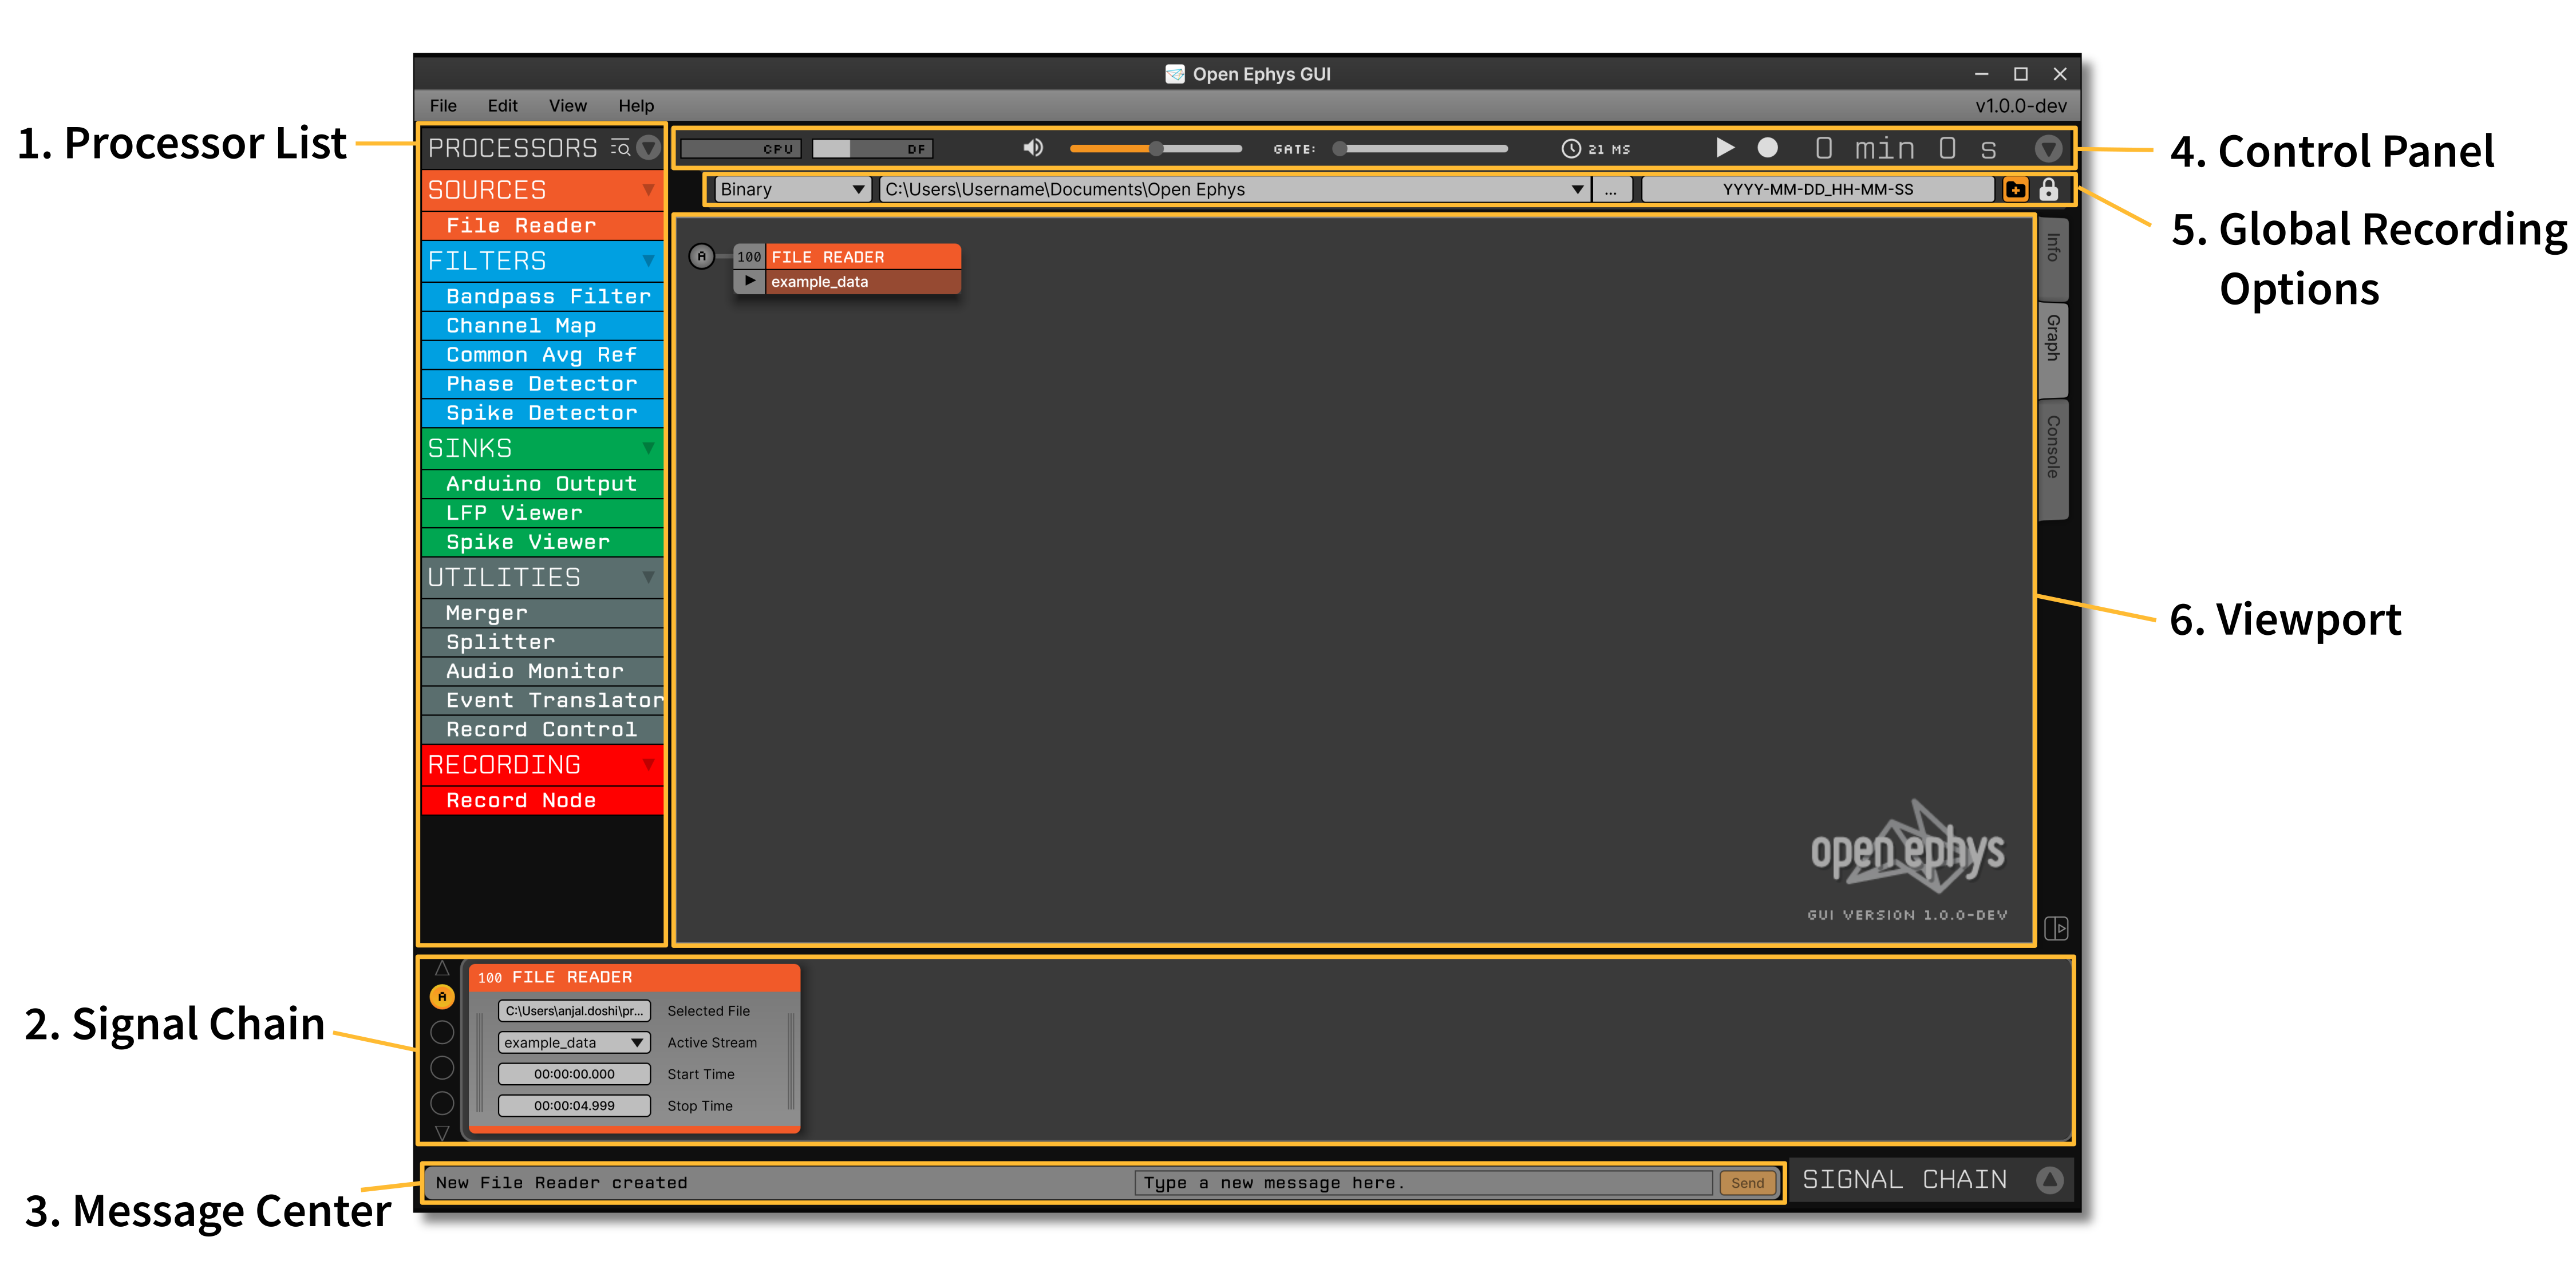
1. Processor List#
Here you’ll find all the available modules for building the signal chain, organized by type. “Sources” bring data into the application, either by communicating with an external device, reading data from a file, or generating samples on the fly. “Filters” alter the data in some way, either by modifying continuous signals or creating new events. “Sinks” send data outside the signal chain, for example to a USB device or a display. “Utilities” are used to construct the signal chain or control recording/audio monitoring, but they don’t modify data in any way. Finally, “Recording” processors are used for saving data. For the most part, “processors” and synonymous with “plugins,” although some processors are built into the GUI, and are therefore not technically plugins.
2. Signal Chain#
The processing pipeline is configured by dragging modules from the Processor List and dropping them in the appropriate order onto the Signal Chain, also known as the “Editor Viewport.” Once a processor has been added to the Signal Chain, its settings will be accessible through a custom interface, called an “editor.” The buttons on the left-hand side of the Signal Chain allow you to toggle between up to 8 different branches of your signal chain (if it contains multiple source processors).
Data flows through the signal chain from left to right. The first processor in each branch must be a Source, and Sources can only appear at the start of a branch.
Processors handle four types of data:
Continuous: data sampled at regular intervals, such as neural signals, auxiliary headstage inputs, or analog input channels.
Events: discrete “on” or “off” signals from hardware TTL inputs (e.g. digital 8 inputs on the Open Ephys Acquisition Board) or upstream processors. Each event is assigned to one of up to 256 lines, which are shared by all processors in the signal chain.
Spikes: special types of events that hold waveforms, timestamps, and cluster IDs for spikes that are detected in the continuous data.
Text events: messages generated by the user or other processors, or sent via the network. Some processors have specific behaviors that are triggered by text events.
In addition, it’s important to keep in mind that every continuous signal, event, and spike must be associated with a single data stream, or a collection of channels that are sampled synchronously. Any time you merge together data from different Sources, channels from each source will belong to different data streams. In addition, some Source processors (such as Neuropixels PXI) generate multiple data streams. In most cases, data from separate streams will be processed independently, because samples from different streams are not guaranteed to be aligned. See the What’s new in version 0.6.x page for more information about modifying parameters for individual streams.
3. Message Center#
At the bottom of the user interface, there is a component for sending and receiving messages. The left side displays important notifications that come from the GUI or its plugins, while the right side allows you to record custom messages during an experiment.
4. Control Panel#
The top of the user interface contains a number of components for controlling the overall behavior of the software, as well as displaying critical status information.
From left to right:
CPU Meter. Displays the fraction of available time that the signal chain takes to complete one processing cycle. The values in this display will differ from your computer’s built-in CPU monitor, and are a better indicator of whether you are hitting your machine’s performance limits. Ideally, the CPU meter should stay below 20% at all times. If it’s spiking to over 50%, it indicates that you are attempting to acquire more channels than your computer can handle, or your signal chain is too complex.
Disk Space Meter. Displays the fraction of available disk space used by the default recording directory. Keep an eye on this meter to ensure that you don’t run out of space for recording data. There are also individual disk space meters inside each Record Node.
Volume Slider. Used to adjust the volume of the GUI’s built-in audio monitor.
Gate Slider. Used to adjust the “gate” of the audio monitor, which enhances the sound of individual spikes while suppressing background noise.
Audio Settings. This button (which displays the audio buffer size in milliseconds) opens the Audio Settings interface. Data acquisition is driven by your computer’s audio card. If you have multiple audio cards installed, this interface can be used to select which one to use. It can also be used to change the size of the audio buffer, which determines the amount of time it takes to complete one processing cycle. If the CPU meter is jumping around a lot, increasing the size of the audio buffer can smooth it out by giving the GUI more time to process each chunk of data that comes in. However, this will increase the average time it takes for the GUI to deliver closed-loop feedback, if your signal chain includes plugins for triggering stimulation based on neural data.
Play. This button is used to start and stop data acquisition. If there are no processors present in the signal chain, it won’t do anything.
Record. This button is used to start and stop recording. Recording is only possible if there is at least one Record Node in the signal chain. If the play button hasn’t been pressed yet, the record button will also start data acquisition.
Clock. The clock displays the amount of time elapsed since data acquisition started. Or, if data is being recorded, it turns red and displays the amount of time since the current recording began.
5. Global Recording Options#
Below the control panel is a collapsible interface for changing recording options. For more information about this component, see the Recording data page.
6. Viewport#
The center of the user interface is used for a variety of different displays, each contained in a separate tab. By default, the viewport shows a high-level overview of the signal chain that allows you to jump to the configuration interfaces for each processor. It also holds larger visualizations that do not fit inside the Signal Chain view at the bottom of the window.
Debug console#
During normal operation, the GUI logs messages to a console, which can be helpful for identifying problems. As of version 1.0, the console is included as a tab in the GUI’s Data Viewport. If you don’t see the console tab, press “shift+C” to add it to the Data Viewport. The console can also be opened as a separate window by right-clicking on the tab name.
Log files#
Every action taken by the user is logged to a file, along with additional information that can be useful for spotting issues when things go wrong. If the GUI exits successfully, the latest log file will be overwritten the next time the GUI is launched. If the GUI crashes, then the name of the latest log file will be appended with a unique date string.
Linux#
Log files are written to /home/<username>/.config/open-ephys/configs-api10
macOS#
Log files are written to /Users/<username>/Library/Application Support/open-ephys/configs-api10.
Windows#
Log files are written to C:\Users\<username>\AppData\Local\Open Ephys\configs-api10.