Spectrum Viewer#
Plugin Type |
Sink |
Platforms |
Windows, Linux, macOS |
Built in? |
No |
Key Developers |
Sumedh Nagrale, Mark Schatza, Josh Siegle, Anjal Doshi |
Source Code |
Installing and upgrading#
The Spectrum Viewer plugin is not included by default in the Open Ephys GUI. To install, use ctrl-P to access the Plugin Installer, browse to the “Spectrum Viewer” plugin, and click the “Install” button.
The Plugin Installer also allows you to upgrade to the latest version of this plugin, if it’s already installed.
Plugin Configuration#
Note
The Spectrum Viewer plugin may take a few seconds to initialize, so please be patient!
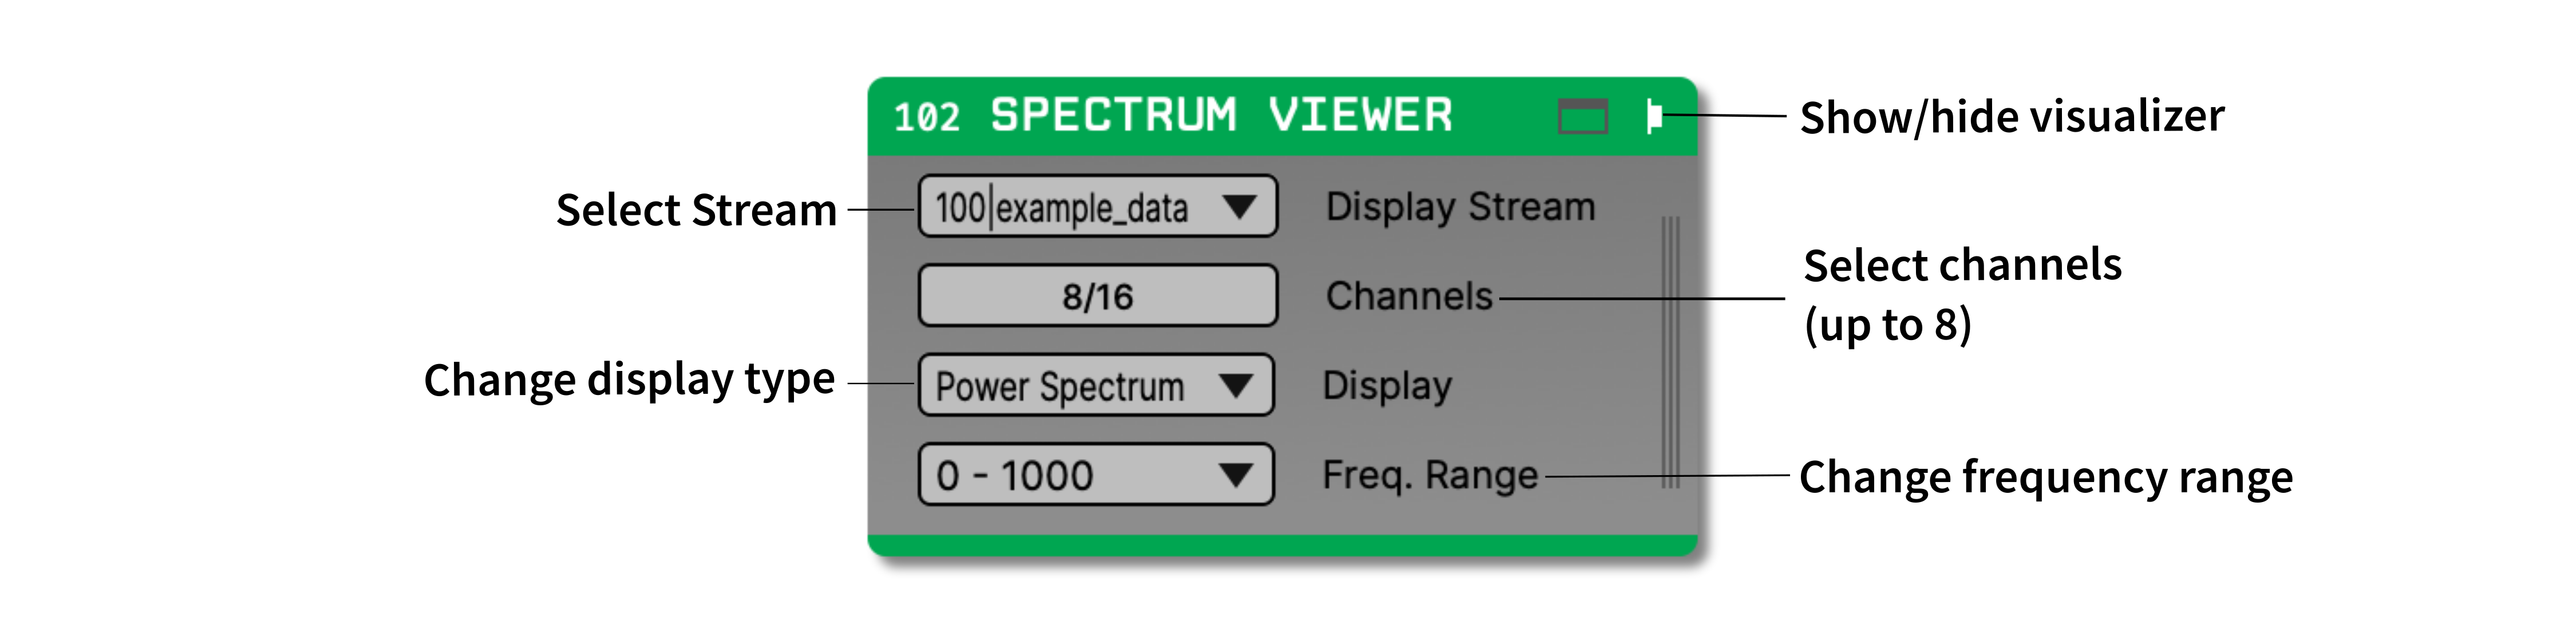
First, make sure the correct stream is selected in the plugin editor. Then, use the “Channels” button to select up to 8 channels to display from the selected stream. A legend shows the colors and names of each selected channel.
Use the “Display” drop-down menu to switch between “Power Spectrum” and “Spectogram” mode. In “Spectrogram” mode, only the first selected channel will be plotted.
The frequency range can be changed between 4 options: 0 - 100Hz, 0 - 500Hz, 0 - 1000Hz (default), or the maximum frequency range possible for the selected stream.
You can update the selected channels and the display type while acquisition is active, but not the selected stream or the display frequency range.
Visualization#
The Spectrum Viewer performs a fast Fourier transform on the incoming signal in chunks of 2 s, 500 ms, 250 ms, or 100 ms, depending on the selected frequency range. New data blocks are added every 20 ms and multiplied by a Hamming window before computing the FFT. The power is plotted on a log scale.
Power Spectrum#
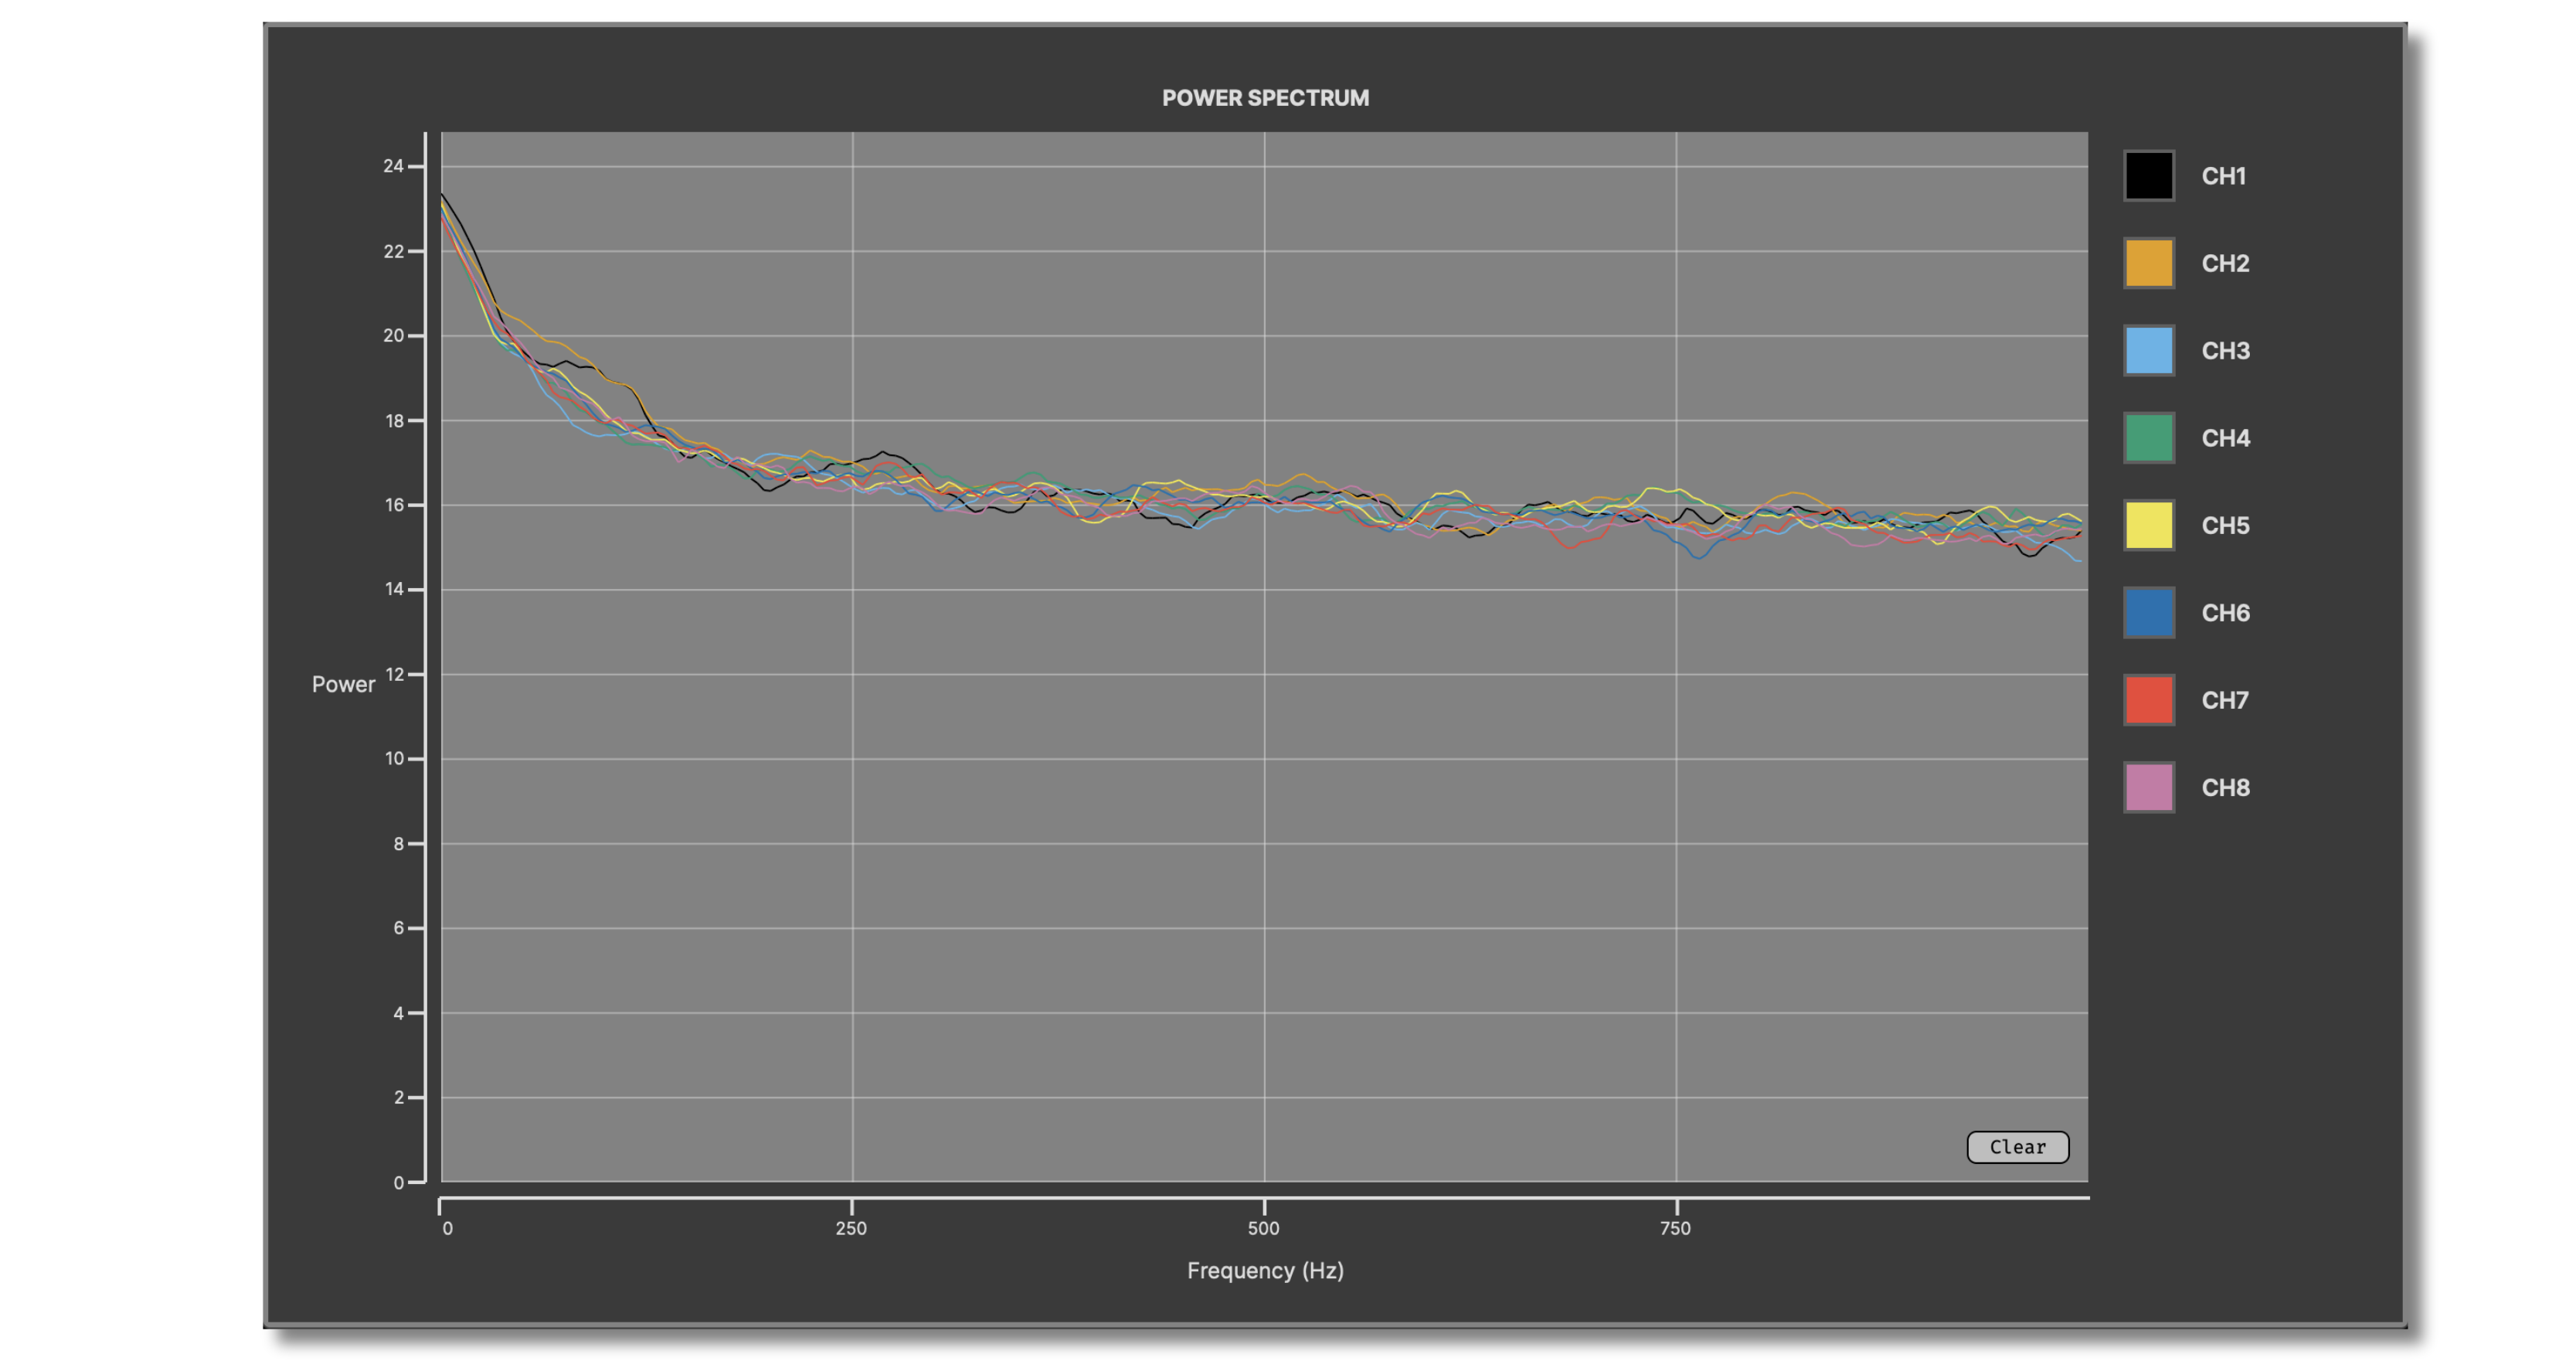
By default, the Spectrum Viewer plots the 1D power spectra of the incoming signals, with frequency on the x-axis. A low-pass Butterworth filter is used to smooth over time, and then a 9-point averaging filter is used to smooth across frequencies.
Spectrogram#
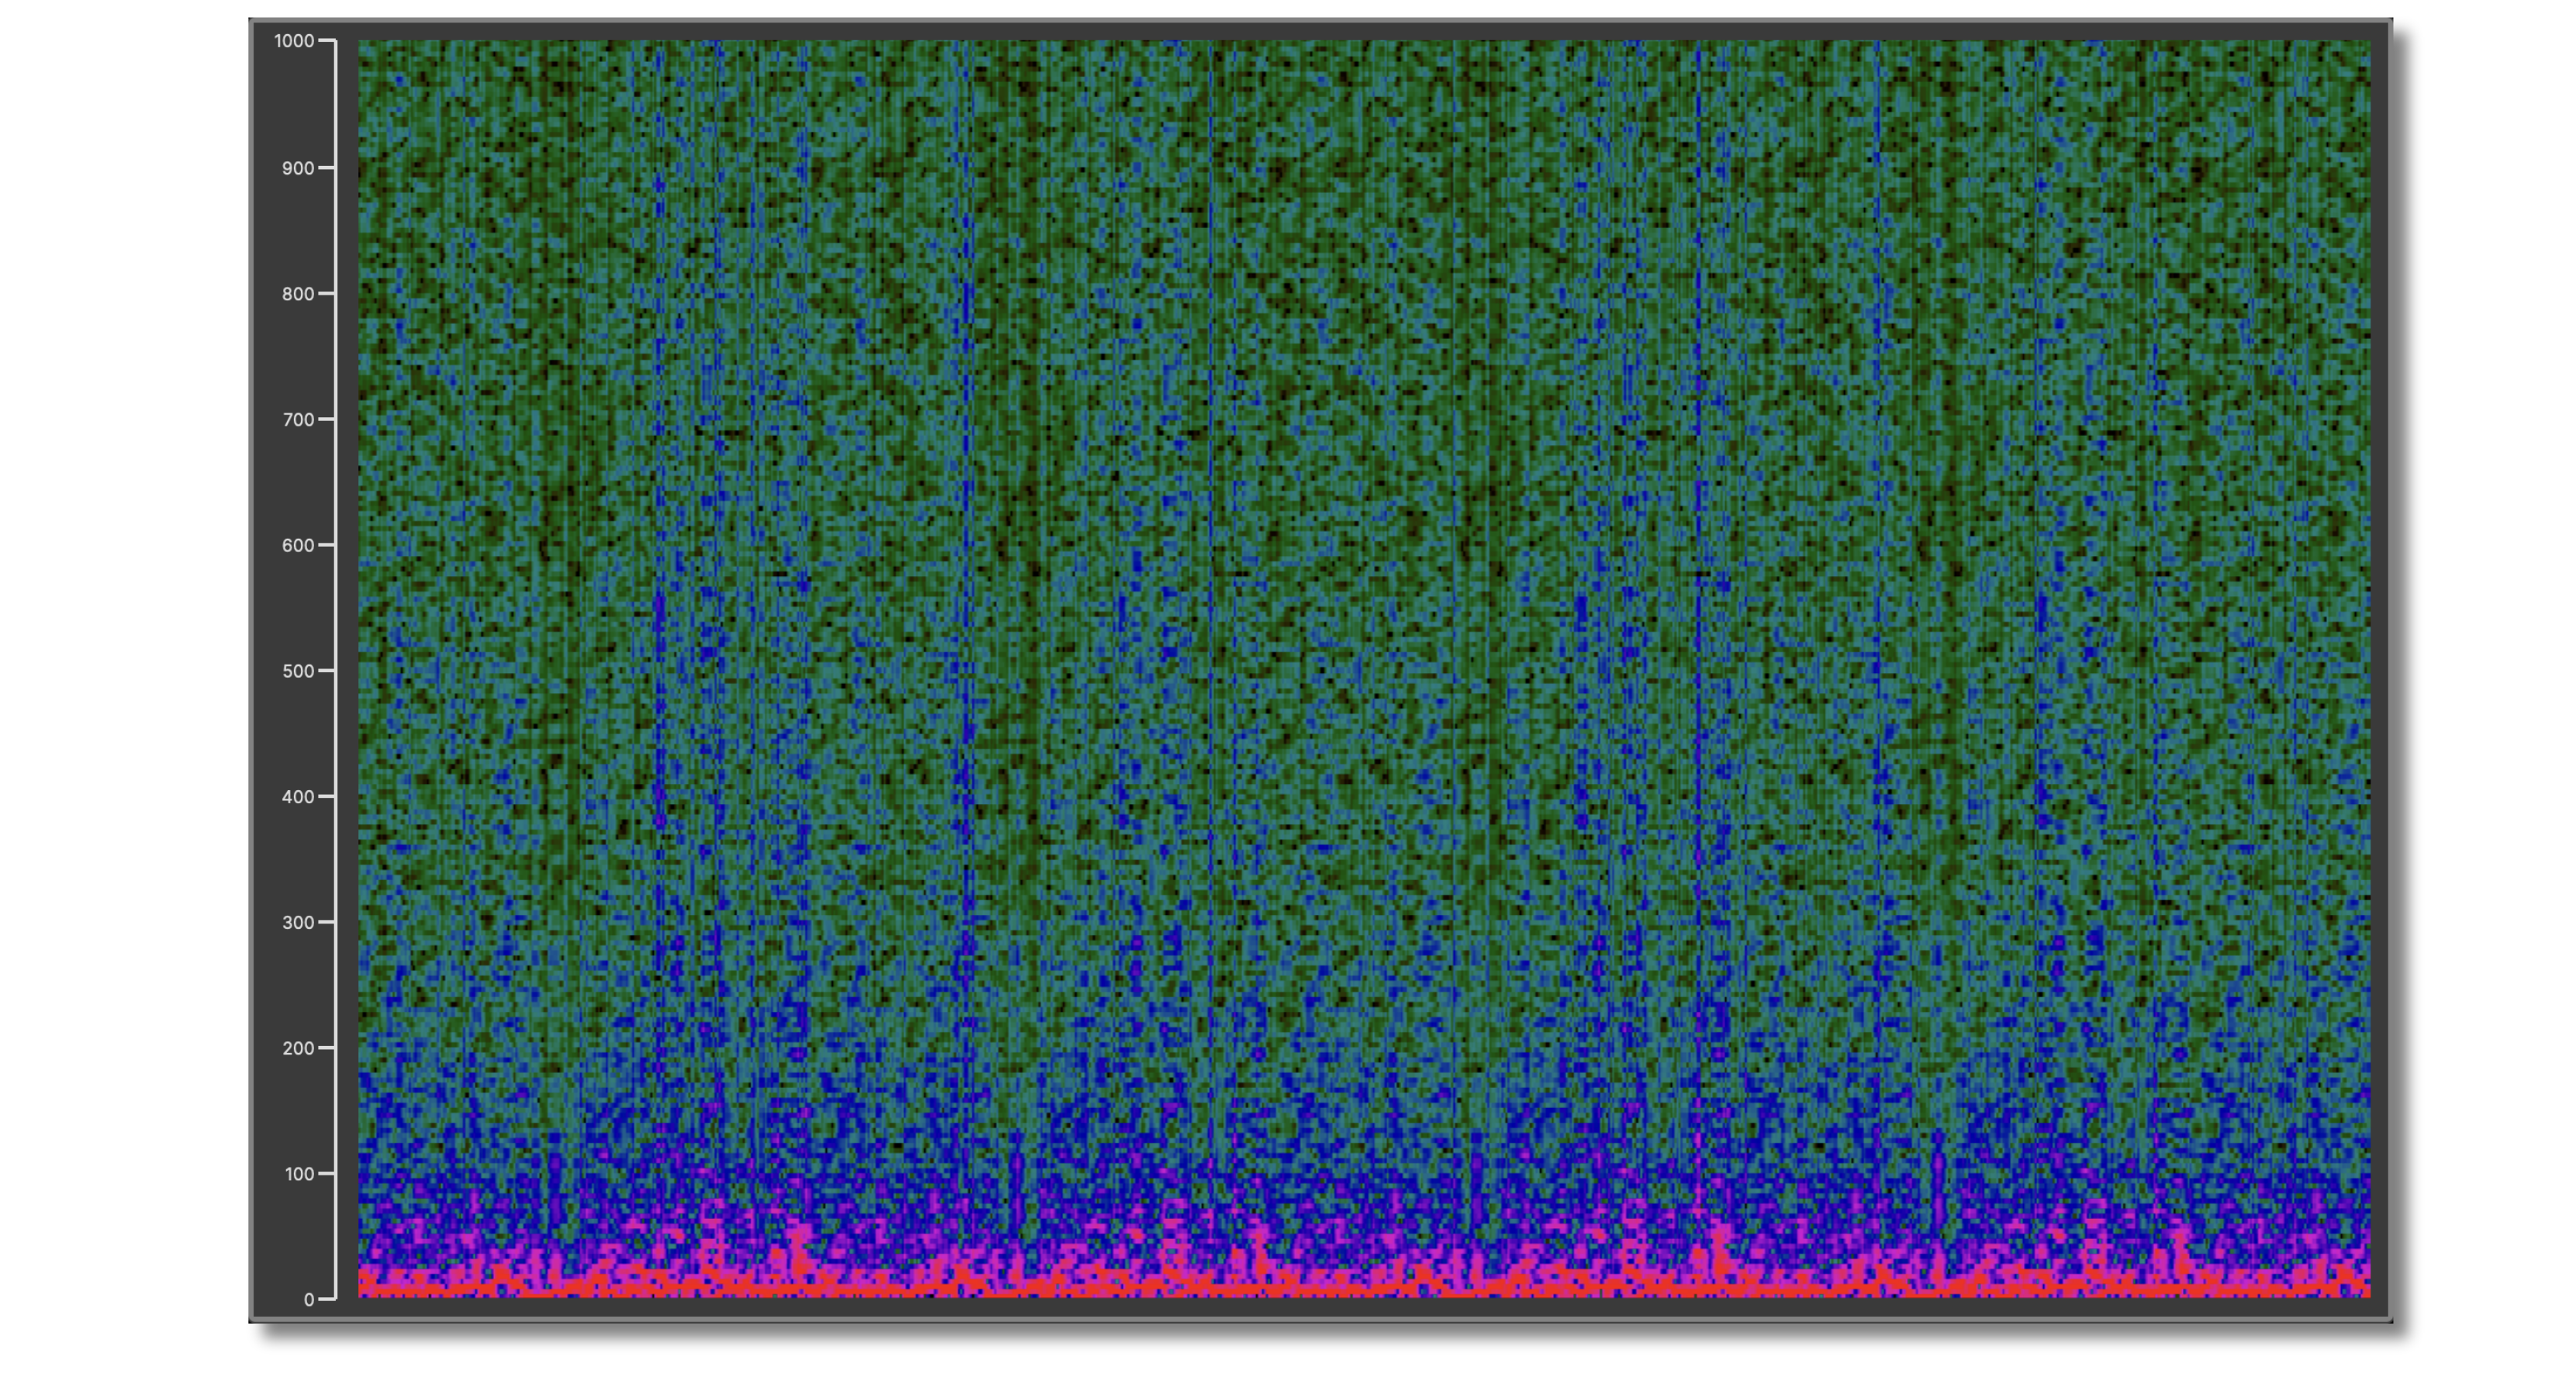
The Spectrum Viewer can also display the incoming data from the first selected channel as a 2D spectrogram with time on the x-axis and frequency on the y-axis, and color representing relative power.