
Quality Monitor#
Plugin Type |
Sink |
Platforms |
Windows, Linux, macOS |
Built in? |
No |
Key Developers |
Anjal Doshi, Josh Siegle |
Source Code |
Installing and upgrading#
The Quality Monitor plugin is not included by default in the Open Ephys GUI. To install, use ctrl-P or ⌘P to open the Plugin Installer, browse to the “Quality Monitor” plugin, and click the “Install” button.
The Plugin Installer also allows you to upgrade to the latest version of this plugin, if it’s already installed.
Recommended signal chain#
The Quality Monitor is designed for high-channel-count extracellular recordings, especially Neuropixels data, but it can be used with any incoming data stream that contains electrode channels. For optimal performance, the Quality Monitor should be placed downstream of a Bandpass Filter and Common Average Reference or Neuropixels CAR plugin.
Because Quality Monitor is a Sink plugin, it does not modify continuous data or event data that pass to downstream processors.
Plugin configuration#
The plugin editor includes two setup controls:
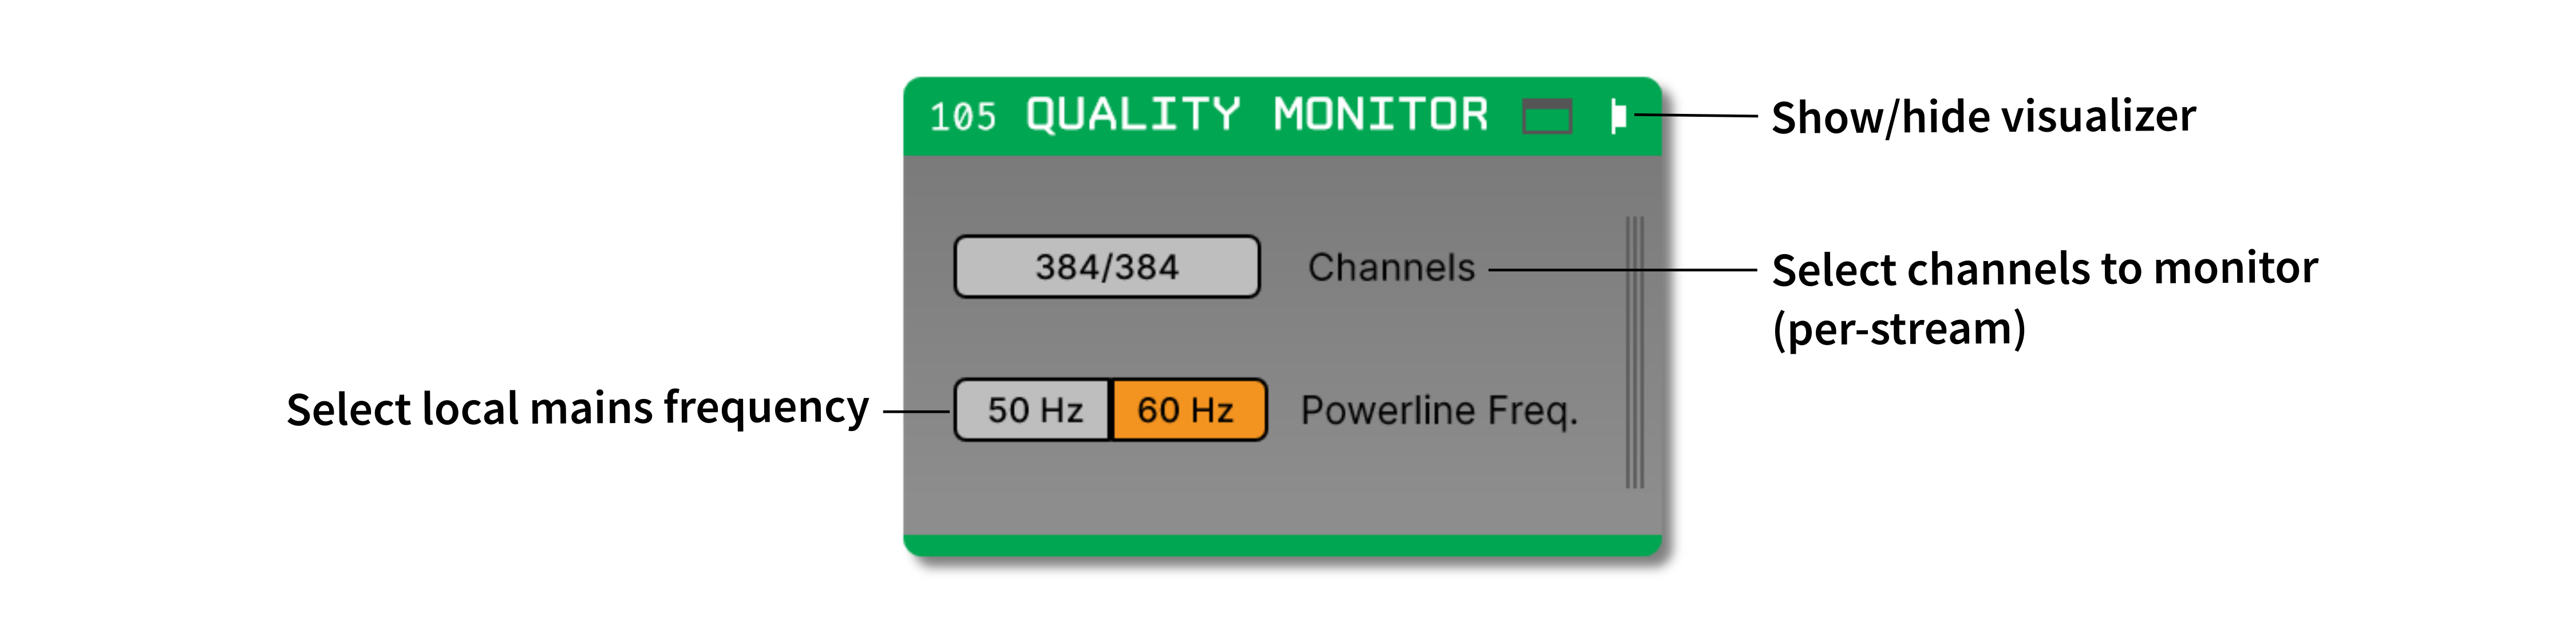
Channels selects which electrode channels from each stream are included in quality monitoring. If no subset is selected, all electrode channels are monitored.
Powerline Freq. sets the local mains frequency used by the spectrum metric. Choose 50 Hz or 60 Hz before starting the analysis.
Quality metric thresholds are adjusted in the visualizer canvas rather than in the compact editor. Open the canvas by clicking the “tab” or “window” buttons at the top right of the plugin editor.
The plugin creates one sidebar entry for each incoming data stream that contains electrode channels. The four diagnostic panels always display metrics for the data stream that is selected in this sidebar. If depth, shank, or position metadata is available from the upstream source, channels are sorted by probe geometry before being displayed. Otherwise, channels are shown in their original stream order.
Running a quality analysis#
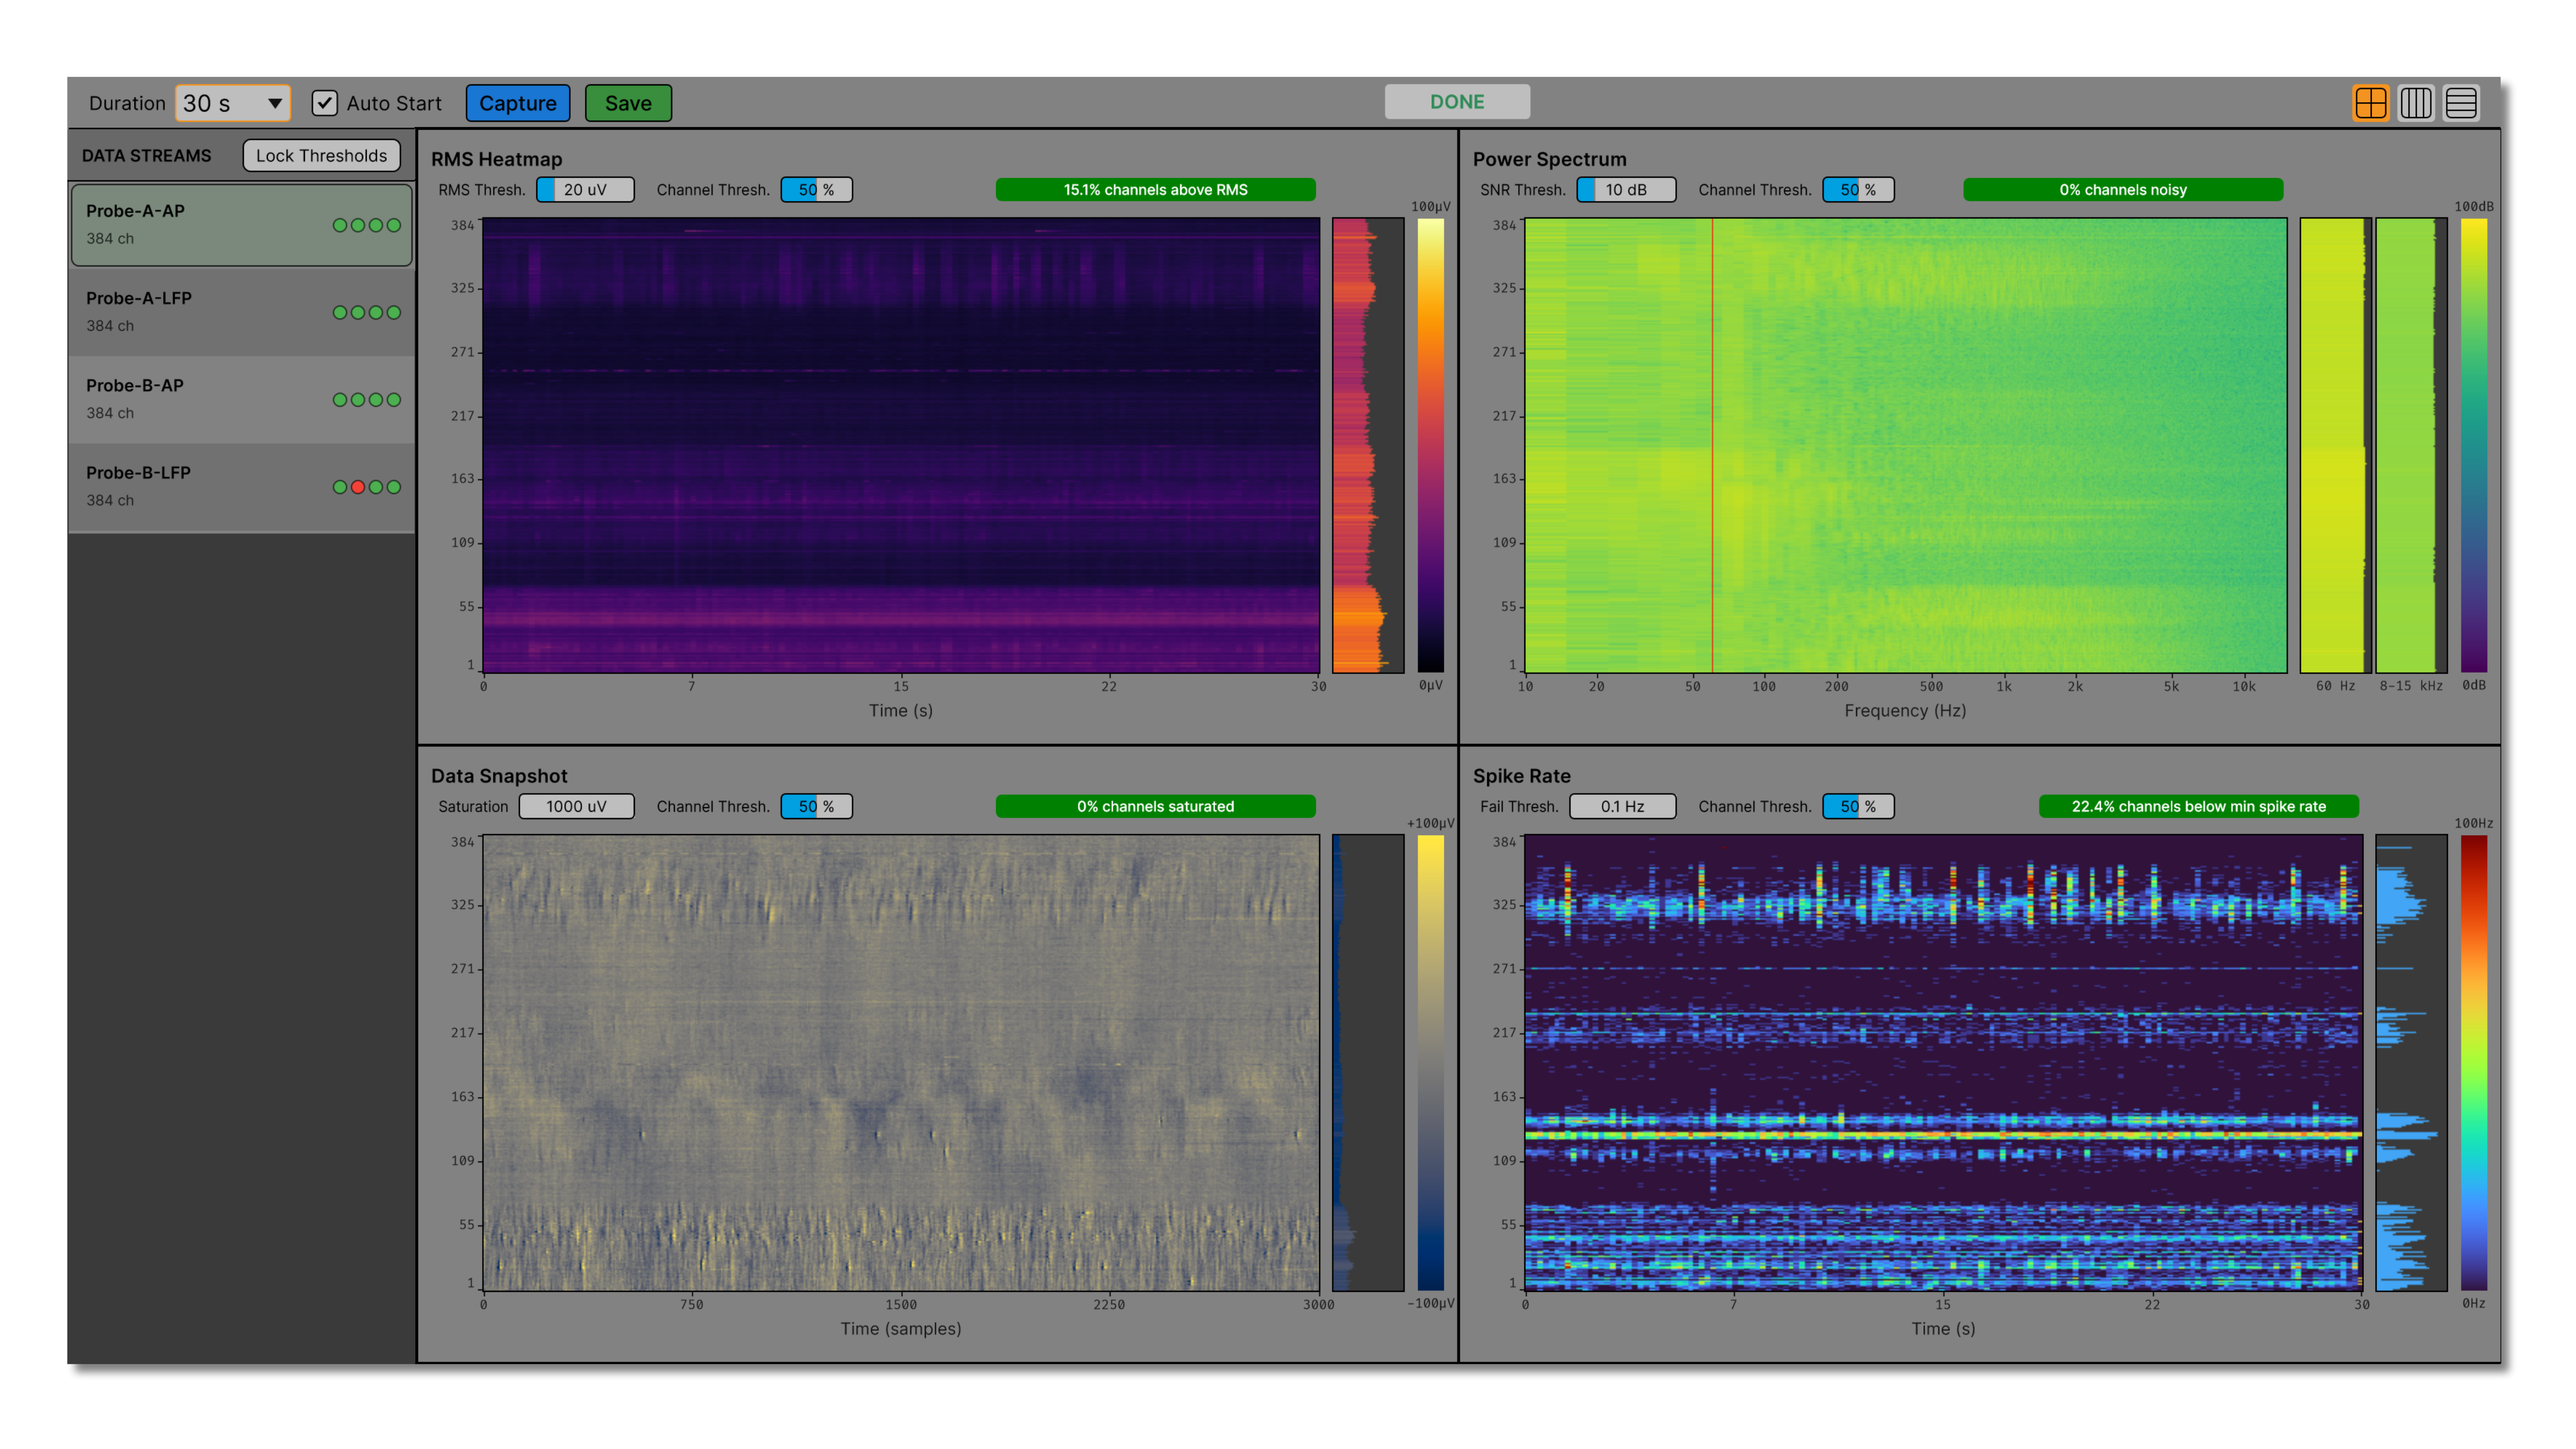
The top bar of the Quality Monitor canvas contains controls for the current analysis run:
Duration selects a 10 s, 30 s, or 60 s analysis window.
Auto Start begins processing automatically whenever acquisition starts. When this option is off, acquisition can be running while Quality Monitor waits for a manual capture.
Capture / Stop manually starts or aborts a run. The button is enabled only while acquisition is active.
Save exports results after all streams have completed the selected analysis duration.
Layout buttons switch the four diagnostic panels between a 2 × 2 grid, a horizontal stack, and a vertical stack.
The status indicator in the header shows whether the plugin is idle, running, or done. The DATA STREAMS sidebar lists all monitored input streams and shows four small status indicators for the RMS, spectrum, snapshot, and spike-rate metrics. Selecting a different stream updates all four panels and their threshold controls.
Note
Because calculating quality metrics is computationally intensive, a quality analysis should be run once at the beginning of the experiment, typically prior to starting recording. Once the analysis is complete, the Quality Monitor has no impact on the performance of the GUI or downstream processors.
Diagnostic panels#
The four diagnostic panels are per-input-stream views. Use the DATA STREAMS sidebar to choose the stream to inspect; the RMS, spectrum, snapshot, and spike rate panels then show channel-by-channel metrics for that stream only.
RMS Heatmap#
The RMS panel shows the root-mean-square amplitude of each channel over time. RMS values are updated every 200 ms and displayed as a channel-by-time heatmap. The live strip on the right shows the latest RMS value for each channel.
Channels with RMS values above the RMS Thresh. value are counted in the panel’s alert badge. This metric is useful for finding channels with high broadband noise, poor contacts, or large artifacts.
Power Spectrum#
The Power Spectrum panel displays spectral power for each channel on a log-frequency axis. The spectrum is computed with a 4096-sample Hanning-windowed FFT.
Two overview strips summarize per-channel noise bands:
50 Hz or 60 Hz shows power around the selected powerline fundamental.
8-15 kHz shows high-frequency noise power.
Channels are counted as noisy when the powerline peak or the high-frequency band exceeds the surrounding/reference band by more than the SNR Thresh. value.
Data Snapshot#
The Data Snapshot panel shows a 100 ms raw voltage image for each channel. The plot uses a fixed -100 μV to +100 μV colour scale, while the overview strip shows the per-channel standard deviation over the snapshot window.
Channels are counted as saturated when any sample in the current run exceeds the Saturation threshold. The default saturation threshold is 1000 μV.
Spike Rate#
The Spike Rate panel estimates threshold-crossing activity on each channel. Spike thresholds are adaptive: after each RMS window, the detection threshold is set to five times that channel’s RMS value, with a small floor for very quiet channels.
The heatmap shows live spike rate over time, and the overview strip shows the cumulative average spike rate for the run. Channels with cumulative rates below the Fail Thresh. value are counted as low-spike-rate channels. The default fail threshold is 0.1 Hz.
Thresholds and pass/fail status#
Each of the four diagnostic plots has a user-adjustable threshold that determines whether the metric passes or fails for each channel. The thresholds are set in the visualizer canvas, and they can be adjusted while a run is in progress.
All plots include a separate Channel Thresh value, which determines the maximum percentage of problematic channels that is allowed before the metric fails.
For example, if the RMS threshold is set to 20 μV and the RMS channel threshold is set to 50%, the RMS metric fails only when more than half of the monitored channels exceed 20 μV RMS.
The overall stream status fails if any of the four metric statuses fail. Otherwise, the stream passes once the run has produced enough data for the metrics to be evaluated.
When Lock Thresholds is enabled, threshold edits for the selected stream are copied to other streams for the same type of device (e.g. Neuropixels 1.0 or Neuropixels 2.0). For Neuropixels 1.0 streams, AP thresholds are copied to matching AP streams and LFP thresholds are copied to matching LFP streams.
Saving results#
After a run completes, click Save and choose an output folder. Quality Monitor creates a timestamped folder named quality-monitor-YYYY-MM-DD_HH-MM-SS containing:
One PNG image per diagnostic panel for each monitored stream.
A
quality_metrics.jsonfile with the analysis duration, stream count, per-stream thresholds, pass/fail statuses, and alert counts.
The JSON summary includes counts for high-RMS channels, noisy channels, saturated channels, and low-spike-rate channels.
Remote control#
Quality Monitor accepts config messages for basic automation:
|
Starts data capture if acquisition is running. |
|
Stops the current data capture run. |
|
Returns a JSON string containing the processing state, per-stream statuses, and alert counts. |
For example, to start a Quality Monitor processor with processor ID 105 using the Open Ephys HTTP API:
import requests

r = requests.put(
    "http://localhost:37497/api/processors/105/config",
    json={"text": "start"})